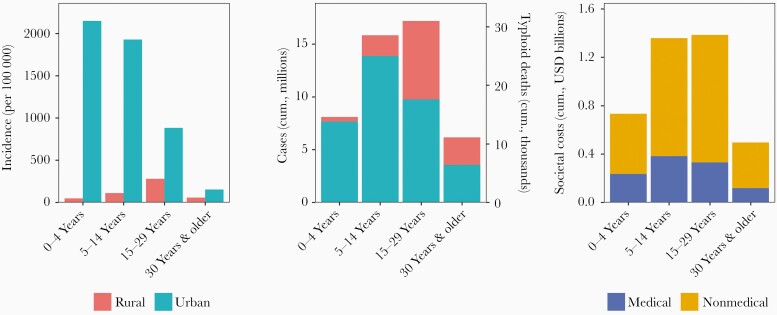
Figure 2.
Typhoid outcomes over the next 10 years under the status quo. Left panel displays projected incidence after 10 years of the status quo of no national vaccination strategy, stratified by age group and urban-rural setting. Middle panel displays projected cumulative cases (left axis) and cumulative typhoid deaths (right axis) over the next 10 years, also stratified by age group and urban-rural setting. Right panel shows cumulative costs over the next 10 years, stratified by age group and medical vs nonmedical (out of pocket and productivity) costs. Costs broken down by urban-rural setting are available in Supplementary Figure 3. Abbreviations: cum., cumulative; USD, United States dollars.

