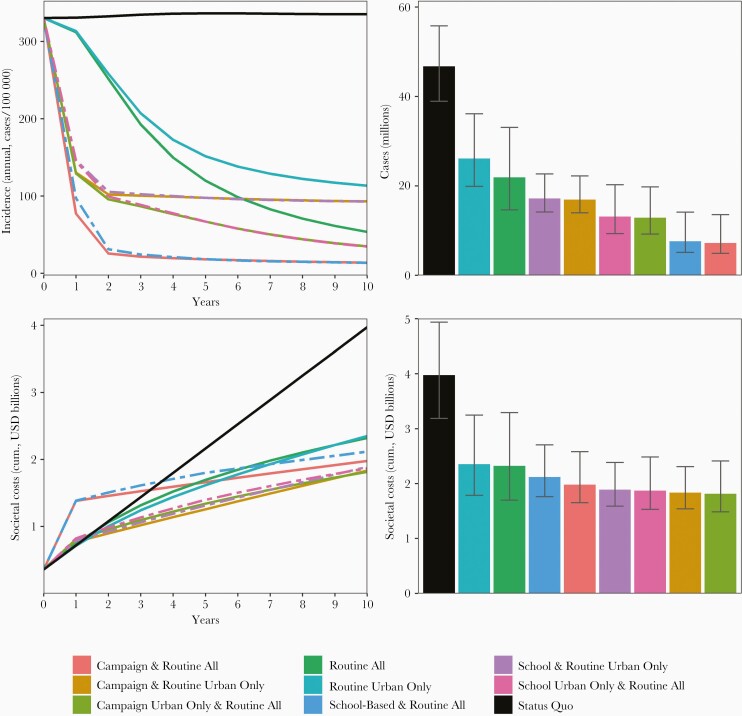
Figure 3.
Typhoid incidence and costs over the next 10 years with typhoid vaccination. Left 2 panels show annual incidence (top) and cumulative costs (bottom) by time and strategy over 10 years of implementation. Right 2 panels show annual incidence (top) and cumulative costs (bottom) after 10 years. In the left 2 panels, school-based strategies are shown with dashed lines. Error bars reflect model parameter uncertainty and were calculated based on the 2.5th and 97.5th quantiles of costs and cases across 10 000 simulations. Error bars do not reflect correlation in outcomes across strategies for a given simulation (eg, high cost ranges for 1 strategy typically correlate with high cost ranges for the remaining 8 strategies). Abbreviations: cum., cumulative; USD, United States dollars.

