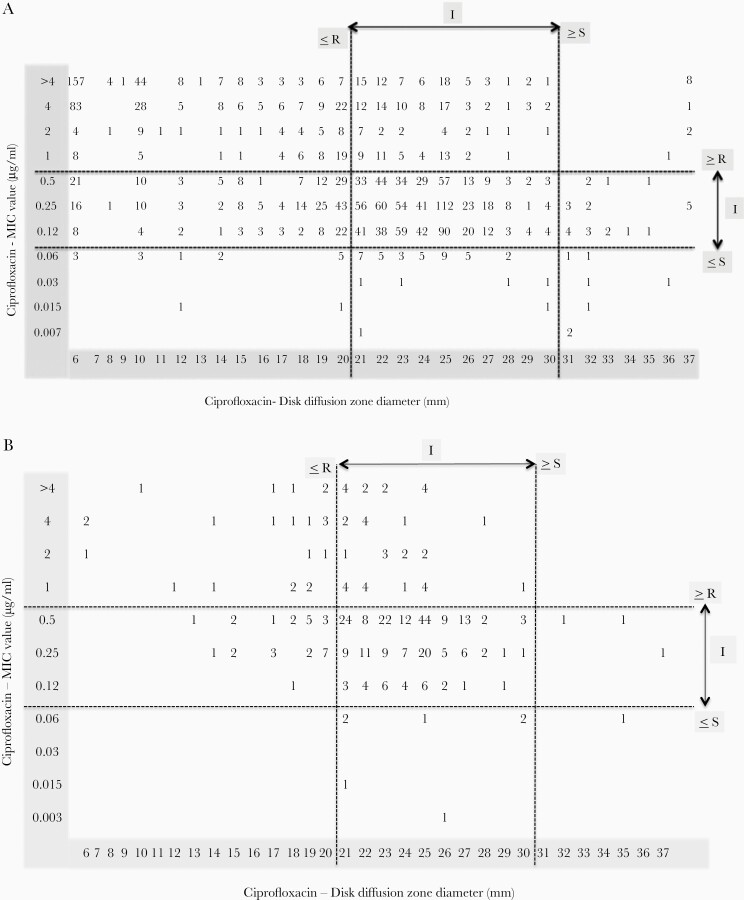
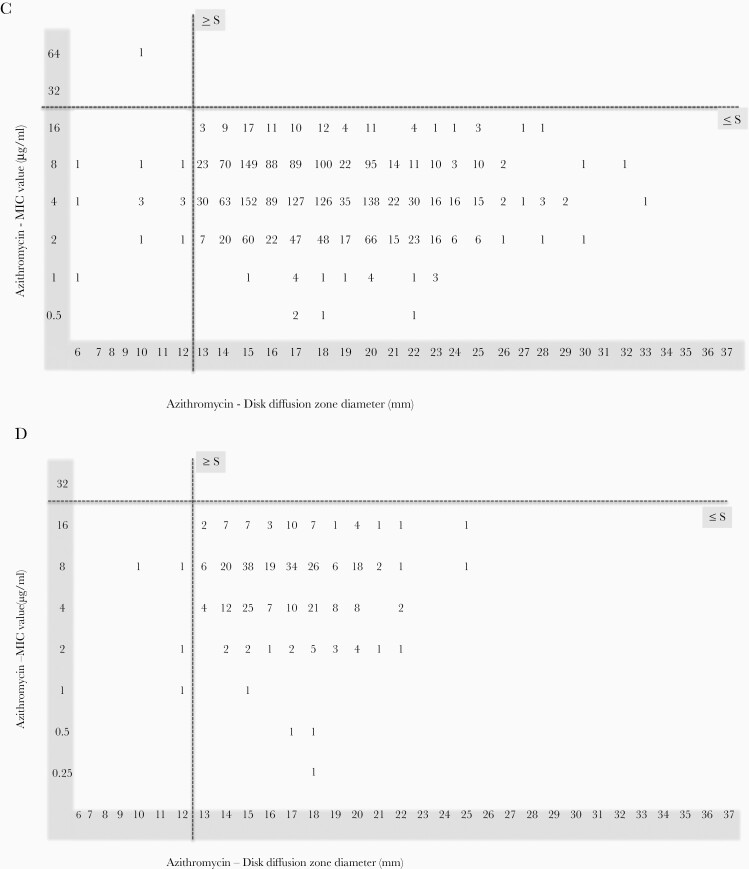
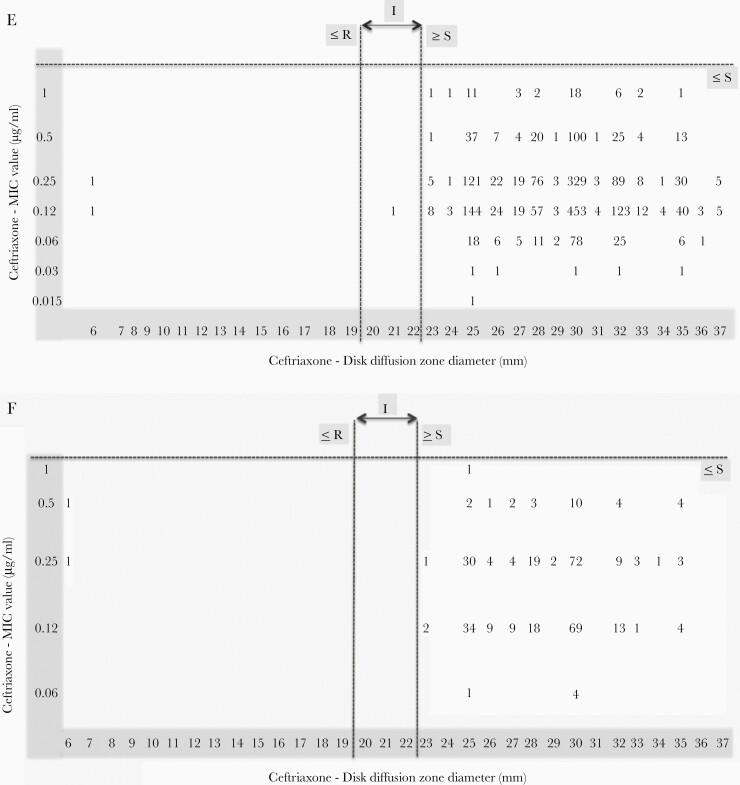
Figure 3.
Relationship between zone of inhibition and minimum inhibitory concentration (MIC) in invasive isolates of Salmonella Typhi and Salmonella Paratyphi A included in this study. (A) Scatter plot of disk diffusion (DD) and MIC value of 2032 S. Typhi isolates tested against ciprofloxacin. (B) Scatter plot of DD and MIC value of 341 S. Paratyphi A isolates tested against ciprofloxacin. (C) Scatter plot of DD and MIC value of 2032 S. Typhi isolates tested against azithromycin. (D) Scatter plot of DD and MIC value of 341 S. Paratyphi A isolates tested against azithromycin. (E) Scatter plot of DD and MIC value of 2032 S. Typhi isolates tested against ceftriaxone. (F) Scatter plot of DD and MIC value of 341 S. Paratyphi A isolates tested against ceftriaxone.


