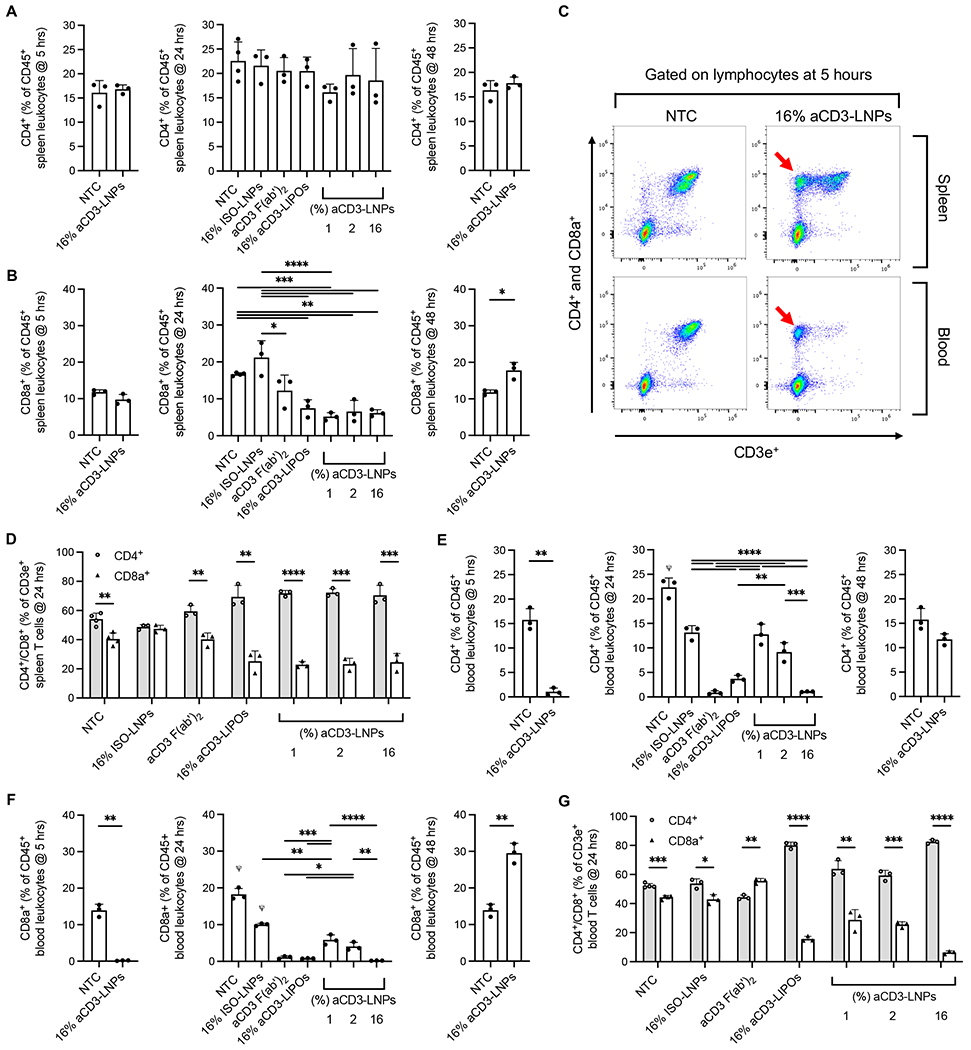
Figure 5. aCD3-LNPs temporarily deplete splenic and circulating CD4+/CD8a+ T cells while reducing CD3 surface expression (n=31 C57BL/6 mice).

A-B) CD4+ (A) or CD8a+ (B) T cells as percentage of total CD45+ splenic leukocytes at 5, 24, and 48 h after control or 1, 2, or 16% aCD3-LNP treatment. C) Representative flow cytometry dot plots (down sampled to 15,000 events each) of splenic and circulating lymphocytes at 5 h after 16% aCD3-LNP or NTC treatment showing CD3e ligand internalization as denoted by red arrows. D) CD4+ and CD8a+ as a percentage of CD3e+ splenic T cells at 24 h after control or 1, 2, or 16% aCD3-LNP treatment. E-F) CD4+ (E) or CD8a+ (F) T cells as a percentage of total CD45+ circulating leukocytes at 5, 24, and 48 h after control or 1, 2 or 16% aCD3-LNP treatment. G) CD4+ and CD8a+ as a percentage of CD3e+ circulating T cells at 24 h after control or 1, 2, or 16% aCD3-LNP treatment. All data are plotted as mean ± SD. For plots with more than 2 groups, statistical analyses were performed using ordinary one-way ANOVAs with Tukey’s multiple comparison test. Plots with 2 groups were statistically analyzed using an unpaired T-test with Welch’s correction. CD4+ and CD8a+ were compared in D and E with an unpaired T-test with Welch’s correction. * p<0.05, ** p<0.01, *** p<0.001, **** p<0.0001. ψ represents p<0.0001 across all groups unless otherwise denoted with statistical analysis lines above.
