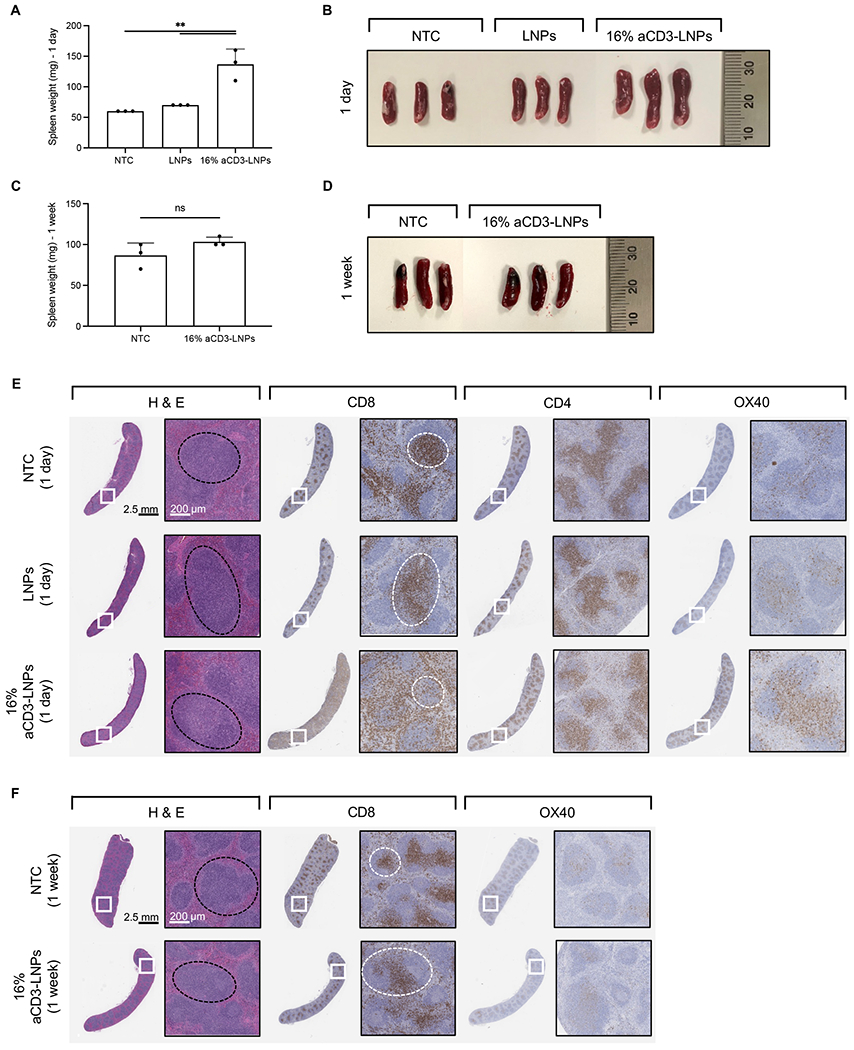
Figure 6. aCD3-LNPs mobilize and activate splenic T cells (n=21 C57BL/6 mice).

Mice were treated with systemic administration of either 16% aCD3-LNPs or non-targeted LNPs, each carrying mCherry, and compared to no-treatment control (NTC). A, B) Spleen weight (A) and size (B) one day after treatment. C, D) Spleen weight (C) and size (D) one-week after treatment. E, F) Histological sections of the spleens harvested one day (E) and one week (F) following each treatment and stained with H&E, aCD8, aCD4, and aOX40. Black and white dashed circles represent the white pulp and the periarterial lymphatic sheaths (PALS) in the spleen sections, respectively. Scale bars are 2.5 mm for the whole section and 200 μm for the magnified section. In A and C, all data are presented as mean ± SD. Statistical analyses were performed using an ordinary one-way ANOVA with Tukey’s multiple comparisons test in A and unpaired T-tests with Welch’s correction in C. ns: not significant. **p<0.01
