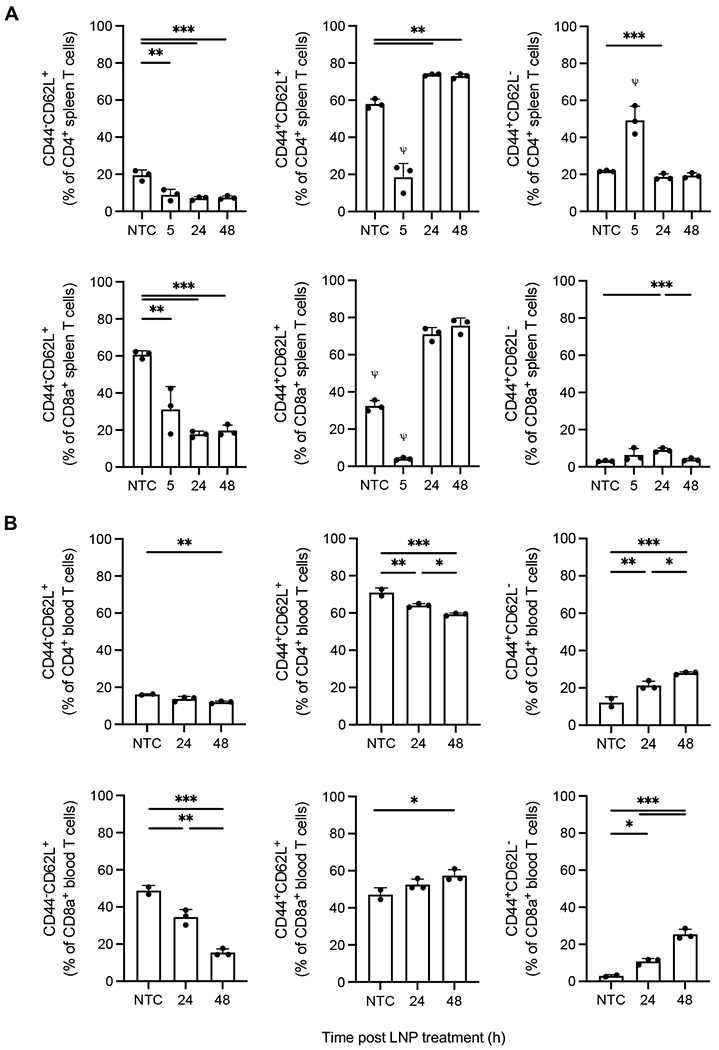
Figure 8. 16% aCD3-LNPs shift the phenotype of splenic and circulating CD4+/CD8a+ T cells (n=12 C57BL/6 mice).

A-B) Splenic (A) and circulating (B) CD4+ and CD8a+ CD44+/−CD62L+/− T-cell frequencies at 5, 24, and 48 h after no-treatment control or 16% aCD3-LNP administration. All data are plotted as mean ± SD. Statistical analyses were performed using ordinary one-way ANOVAs with Tukey’s multiple comparison test. * p<0.05, ** p<0.01, *** p<0.001. ψ represents p<0.0001 across all groups unless otherwise denoted with statistical analysis lines above.
