
FIGURE 2.
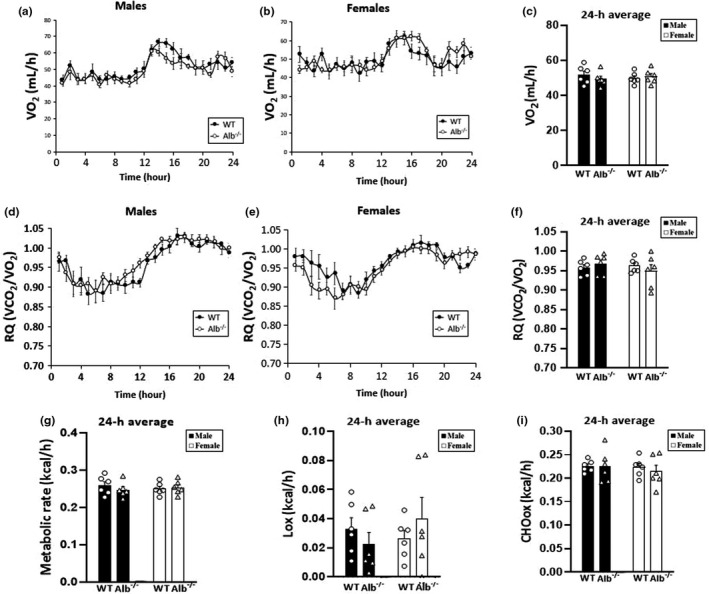
Indirect calorimetry results. (a–c) Oxygen consumption (VO2); (d–f) Respiratory quotient (RQ); (g) 24‐h average of metabolic rate, (h) 24‐h average of lipid oxidation (Lox), and (i) 24‐h average of carbohydrate oxidation (CHOox). n = 6 mice per group. Analysis of RQ by ANOVA. Analysis of VO2, metabolic rate, Lox, and CHOox by ANCOVA with body weight as the covariate