
FIGURE 3.
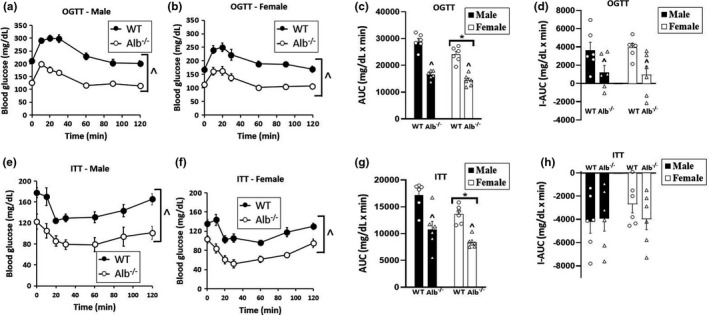
Oral glucose tolerance test (OGTT) and insulin tolerance test (ITT). Blood glucose over time for OGTT (a, b) and ITT (e, f). AUC, area under the curve for blood glucose concentration (c, g). I‐AUC, incremental AUC for blood glucose concentration (d, h). n = 6 mice per group. Analysis by ANOVA. ^Alb−/− significantly different from WT (main effect of genotype, p < 0.05). For OGTT, post hoc testing indicated significant difference at every time point, while for ITT individual time points were not tested statistically because there was no significant interaction with the time factor in ANOVA. *Females significantly lower than males (main effect of sex, p < 0.05)