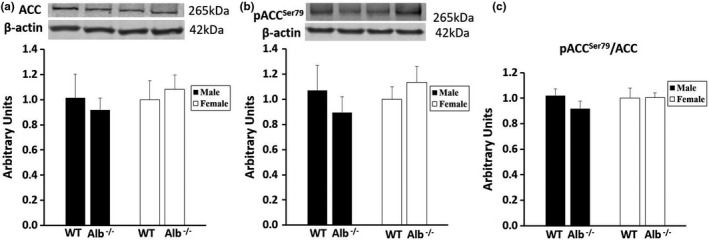
FIGURE 5.

Acetyl CoA carboxylase (ACC) in liver. (a) Western blot for total ACC, (b) phosphorylated ACC, and (c) the ratio of phosphorylated to total ACC. n = 6 mice per group. Band intensity for each protein of interest was normalized to band intensity for β‐actin, and the arbitrary units scale was adjusted such that average WT female would be a value of 1. Analysis by ANOVA. No significant differences between groups
