
FIGURE 6.
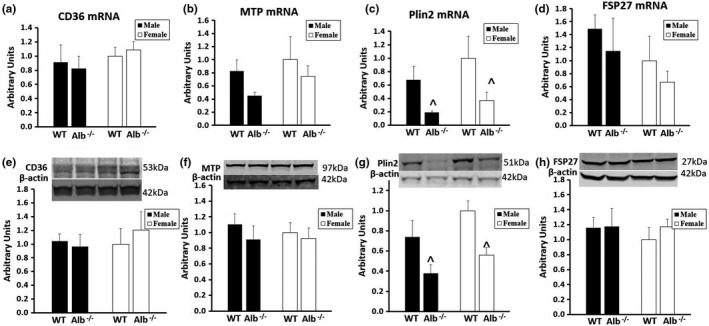
Gene expression (a–d) and protein expression (e–h) in liver. n = 6 mice per group. Gene expression normalized to 18S. Band intensity for each protein of interest was normalized to band intensity for β‐actin, and the arbitrary units scale was adjusted such that average WT female would be a value of 1. Analysis by ANOVA. ^Alb−/− significantly different from WT (main effect of genotype, p < 0.05)