
FIGURE 9.
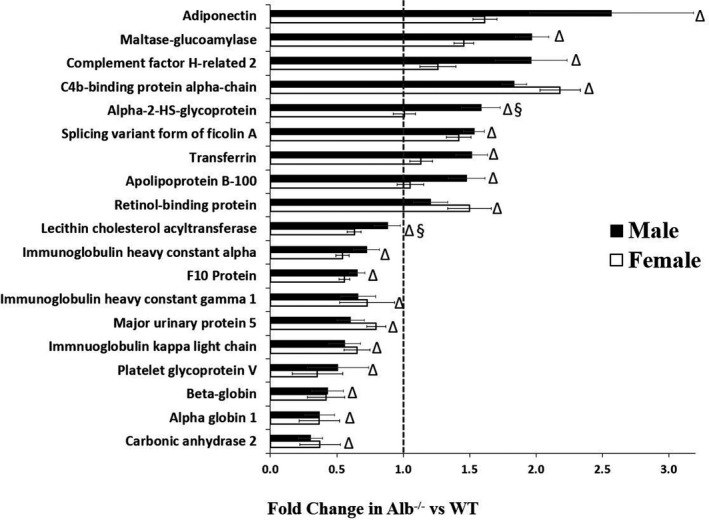
Plasma proteome. Proteins listed in the figure exhibited at least a 1.5‐fold difference between WT and Alb−/−. n = 6 mice per group. By two‐way ANOVA (genotype × sex), each of the proteins listed in the figure achieved a significant main effect of genotype (p < 0.05); LCAT and alpha‐2‐HS‐glycoprotein also exhibited a genotype‐by‐sex interaction, and post hoc testing indicated that each of these two proteins was only significantly altered in one sex. Δ, significant main effect of genotype. §, significant sex‐by‐genotype interaction. Fold‐change > 1 indicates albumin knockout higher than WT. Fold‐change of 0.67 is equivalent to a 1.5‐fold change for protein that exhibited reduced expression in Alb−/−