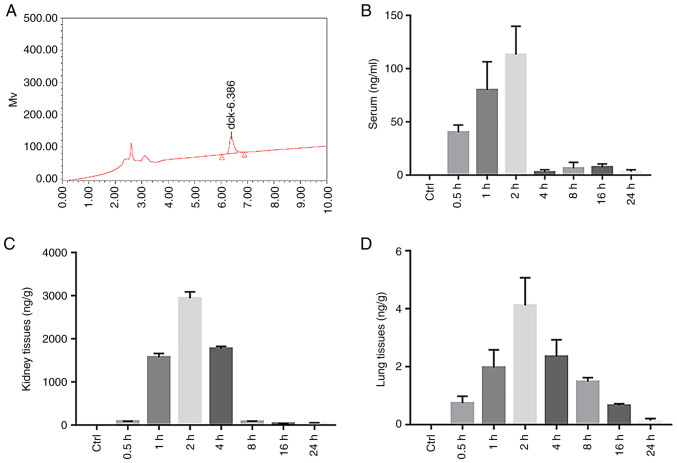
Figure 5.
The content of diquat in the plasma, kidney and lung tissues of rats. (A) HPLC of the diquat standard. (B) Histogram of the serum diquat concentration in the Control (Ctrl) and Experimental group (at 0.5, 1, 2, 4, 8, 16 and 24 h after diquat exposure). (C) Histogram of kidney diquat concentration in the Control (Ctrl) and Experimental group (at 0.5, 1, 2, 4, 8, 16 and 24 h after diquat exposure). (D) Histogram of lung diquat concentration in the Control (Ctrl) and Experimental group (at 0.5, 1, 2, 4, 8, 16 and 24 h after diquat exposure).

