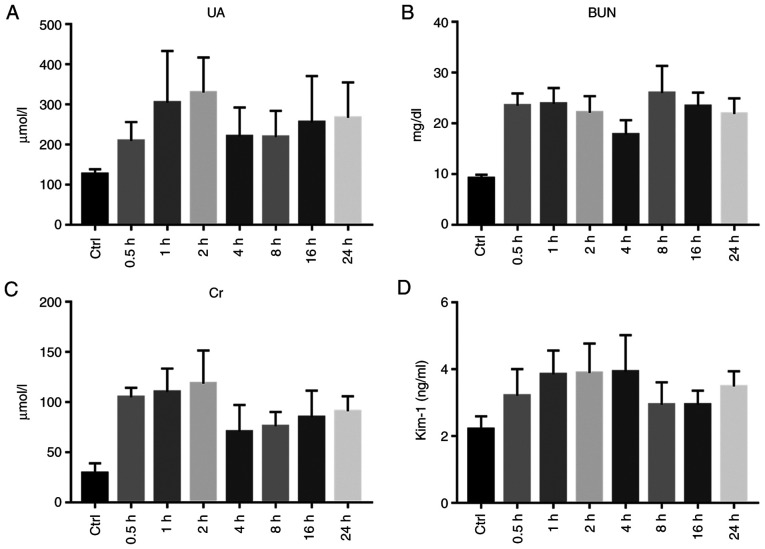
Figure 7.
Renal function. (A) Statistical chart of serum uric acid (UA) level in the Control (Ctrl) and Experimental group (at 0.5, 1, 2, 4, 8, 16 and 24 h after diquat exposure). (B) Statistical chart of serum urea nitrogen (BUN) level in the Control (Ctrl) and Experimental group (at 0.5, 1, 2, 4, 8, 16 and 24 h after diquat exposure). (C) Serum creatinine (Cr) level of rats in the Control (Ctrl) and Experimental group (at 0.5, 1, 2, 4, 8, 16 and 24 h after diquat exposure). (D) Statistical chart of serum kidney injury molecule-1 (KIM-1) content in the Control (Ctrl) and Experimental group (at 0.5, 1, 2, 4, 8, 16 and 24 h after diquat exposure).

