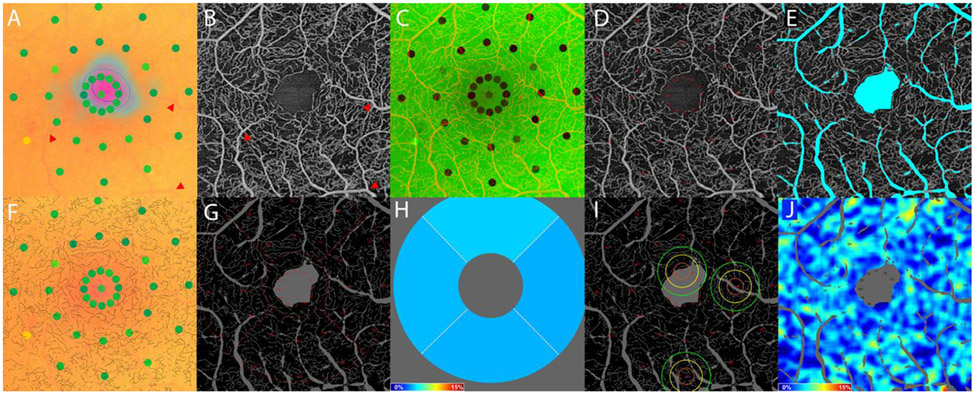
Figure 1.
Image analysis methodology using images from the right eye of a patient with severe non-proliferative diabetic retinopathy. The microperimetry exam output was transformed so as to be spatially aligned with its corresponding 3 mm x 3 mm OCTA image. (A) The microperimetry exam does not map to the center of the fixation cloud. (A-B) Registration was performed using large vessel bifurcations (e.g., those pointed to with red arrows). (C) Microperimetry exam and OCTA image registration overlay. (D) Microperimetry sensitivity positions were transformed from the microperimetry coordinate frame into the 3x3mm OCTA coordinate frame. (E) Large vessels and the FAZ were masked prior to OCTA image processing to exclude from analysis. (F) The 3 mm x 3 mm OCTA images were binarized using Otsu’s method, then skeletonized, and overlaid onto the registered microperimetry image to confirm registration accuracy. (G) Global and zonal skeletonized vessel density were computed from the skeletonized vessel image, excluding the large vessels and FAZ. (H) The zonal skeletonized vessel density was computed within the superior, inferior, nasal, and temporal inner subfields of the ETDRS grid centered on the FAZ. (I) Three examples of local skeletonized vessel density calculations centered at microperimetry points #1, #16, and #31 with kernel isocontours at 1σ (orange), 2σ (yellow), and 3σ (green). (J) Skeletonized vessel densities were extracted from each position of sensitivity measurement.

