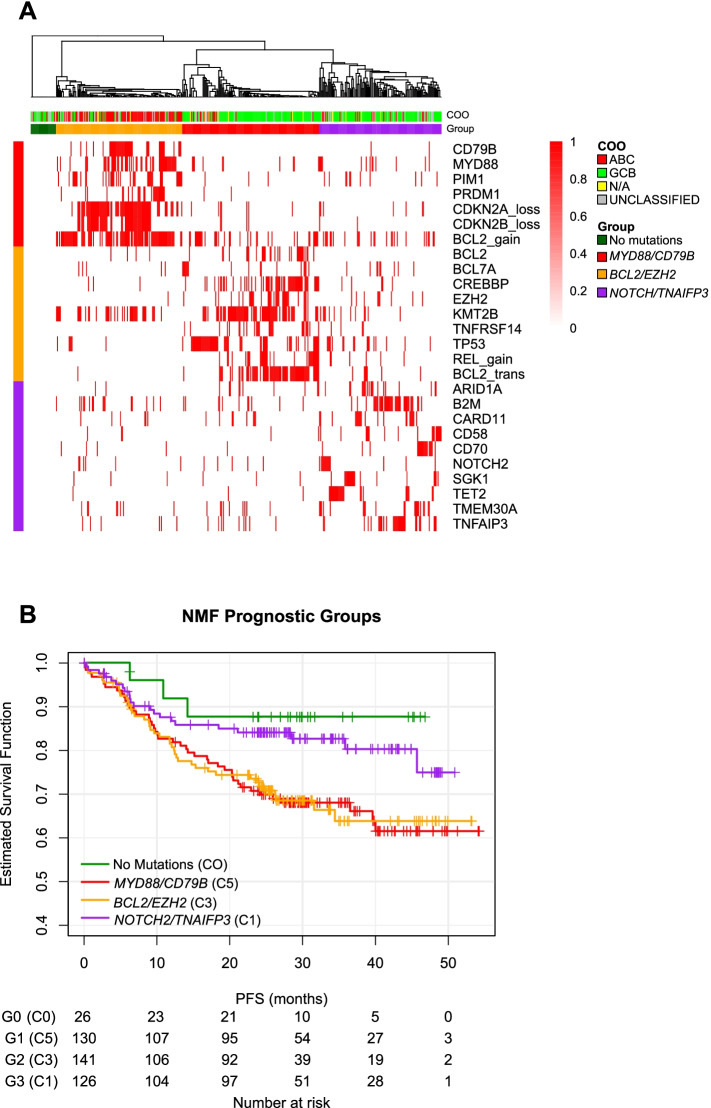
Fig. 1.
NMF-defined clusters (5% prevalence cut-off) in GOYA and their association with cell-of-origin and Kaplan-Meier curves of individual groups. A Clustering by patient into four groups: CD79B/MYD88 (red), BCL2/EZH2 (orange), NOTCH2/TNAIFP3 (purple), and a group with no mutations (green). B Kaplan-Meier curves of PFS for the four NMF prognostic groups. Genomic features represent mutations, copy number alterations (loss/gain), and translocations (trans) as binary values, and are assigned to groups by Fisher’s test (p < 0.1 cut-off). COO association is displayed on the top track. No additional stratification according to treatment arm was performed (R-CHOP + G-CHOP). COO, cell-of-origin; NMF, non-negative matrix factorization; PFS, progression-free survival

