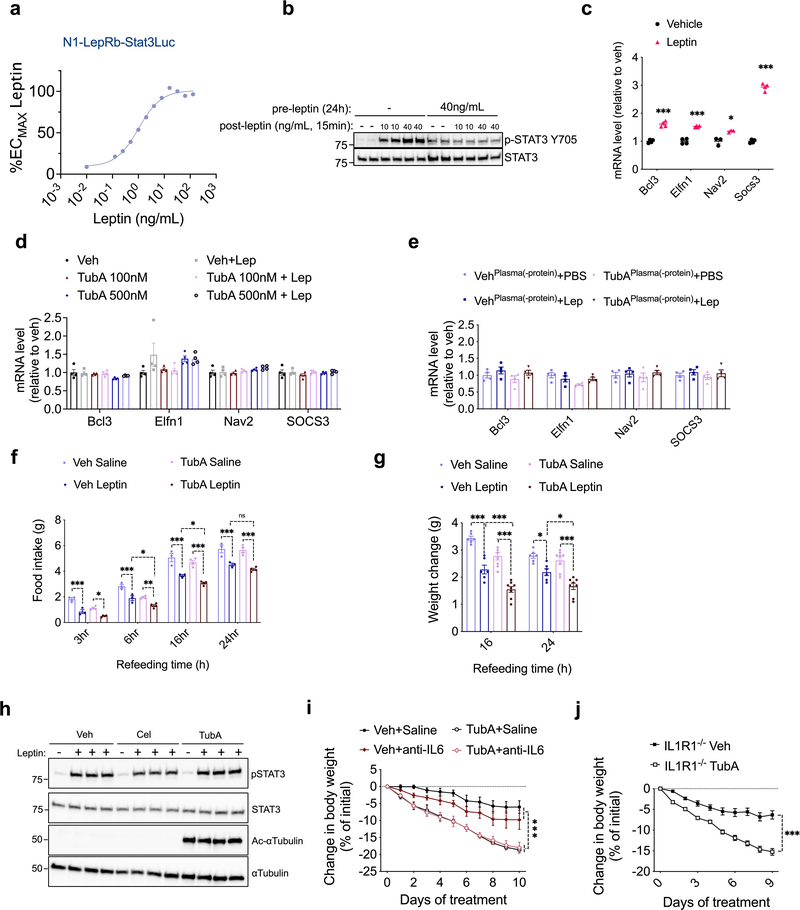
Extended Data Fig. 9. The anti-obesity effect of HDAC6 inhibition requires a potentially unidentified systemic factor.
a, Leptin dose-response curves of N1-LRb cells stably expressing the luciferase construct under a STAT3-responsive promoter (n=32 per time point). b, Immunoblots for pSTAT3 and total STAT3 from the lysates of N1-LRb cells pre-treated with leptin or PBS for 24hr followed by leptin stimulation at the indicated doses. c, mRNA expression of leptin responsive transcripts in N1-LRb cells treated with vehicle or leptin (100 ng/mL) for 4h (n=3 for Nav2; n=4 for other groups, Bcl3 P=3.9E-5, Elfn1 P=4.5E-5, Nav2 P=0.012, Socs3 P=1.5E-7 by multiple unpaired t-test). d, mRNA expression of leptin responsive transcripts in N1-LRb cells treated with TubA at indicated doses for 2hr, and stimulated with leptin (2 ng/mL) for 4hr (n=4). The results was confirmed in two independent experiments. e, Plasma from vehicle or TubA-treated ob/ob mice was deproteinized by proteinase K treatment followed by heat inactivation. Expression of the leptin responsive transcripts in N1-LRb cells pre-treated with deproteinized plasma for 2h, followed by leptin (2 ng/mL) stimulation for 4h (n=4). f, g, Food intake (Veh Saline vs. Veh Leptin; 3h P=3.6E-4, 6h P=7.2E-4, 16h P=8.7E-7, 24h P=1.3E-5; TubA Saline vs. TubA Leptin; 3h P=0.011, 6h P=9.4E-3, 16h P=9.4E-10, 24h P=7.1E-9; Veh Leptin vs. TubA Leptin: 3h P=0.34, 6h P=0.038, 16h P=0.032, 24h P=0.30) and body weight change (Veh Saline vs. Veh Leptin; 16h P=1.2E-6, 24h P=0.014; TubA Saline vs. TubA Leptin; 16h P=8.7E-9, 24h P=3.2E-6; Veh Leptin vs. TubA Leptin: 16h P=8E-4, 24h P=0.025 by two-way ANOVA with Tukey’s post-hoc test for f and g) of 24h-fasted lean HDAC6AdipoΔ mice upon treatment with vehicle, saline, TubA and/or leptin (n= 6 mice for Veh groups, n=8 mice for TubA groups). h, N1-LepRb cells were treated with celastrol (500nM) or tubastatin (1μM) for 24hr, and stimulated with leptin for 15min. The level of STAT3 phosphorylation and αtubulin acetylation was analyzed by immunoblots, and confirmed in two independent experiments. i, Body weights of DIO wild-type mice treated with vehicle (n=4), tubastatin (n=3), IL6 neutralizing antibodies (anti-IL6, n=4), or tubastatin+anti-IL6 (n=4; Veh+Saline vs. TubA+Saline P=3.2E-9, Veh+anti-IL6 vs. TubA+anti-IL6 P=3.3E-5 by two-way ANOVA with Tukey’s post-hoc test). j, Body weight change of DIO IL1R1 KO mice treated with vehicle (n=5) or tubastatin (n=6, P=1E-15 by two-way ANOVA with Sidak correction). *P<0.05, **P<0.01, ***P<0.001 as analyzed Student’s t-test, two-way ANOVA with Tukey’s post-hoc test, or Sidak’s multiple comparison. Data are represented as mean ± s.e.m.

