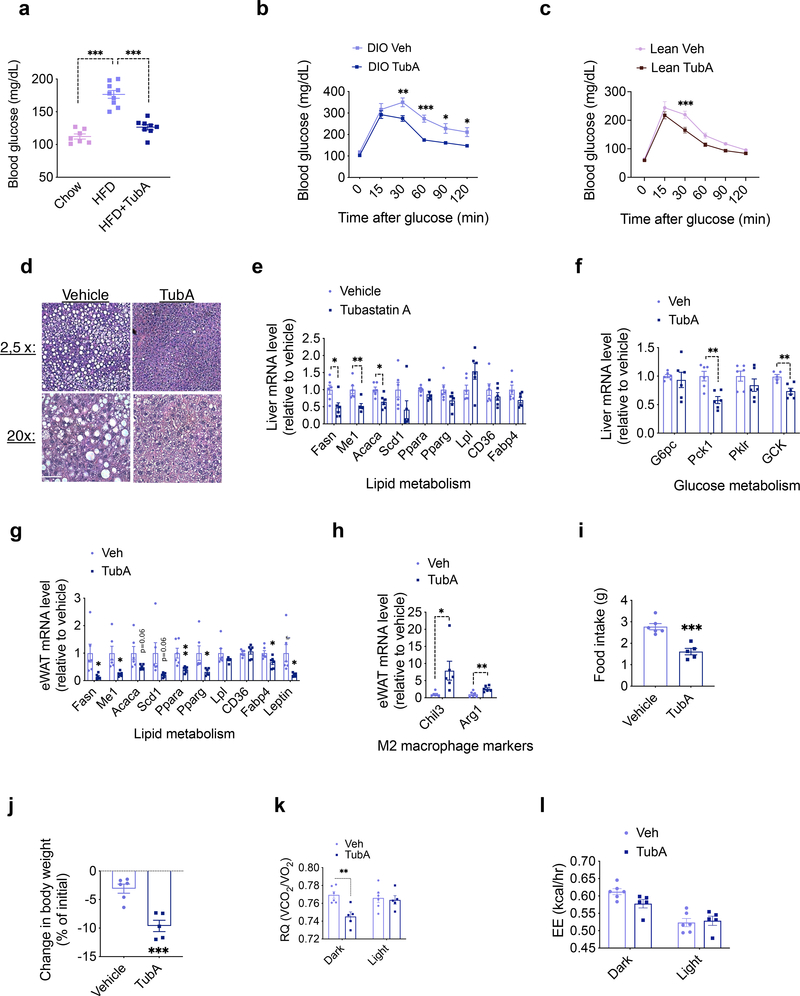
Fig. 3. Tubastatin Treatment Improves Metabolic Function in Diet-Induced Obese Mice.
a, 6 hr day-time fasting blood glucose measured 10 weeks after treatments (n=7, chow; n=9 HFD; n=8, HFD+TubA; chow vs. HFD P= 3.1E-8, HFD vs. HFD+TubA P=9.6E-7). b, c, Glucose tolerance tests performed after vehicle or TubA treatment of DIO wild-type mice (n=6 vehicle, n=6 TubA; 30min P=0.0076, 60min P=2.3E-4, 90 min P=0.023, 120min P=0.035) (b) or lean wild-type mice (n=8 vehicle, n=8 TubA; P=5.8E-4) (c). d, Hematoxylin and eosin (H&E) staining of liver sections of DIO mice after one month of vehicle or TubA treatment. Scale bar 50μm e, f, Expression of hepatic lipid (e) and glucose (f) metabolism genes analyzed by RT-qPCR 5 days of vehicle or tubastatin treatment of DIO wild-type mice (n=6; Me1 P=0.0047, Acaca P=0.011, Fasn P=0.021, Pck1 P=0.0024, GCK P=0.0041)). g, h, qPCR analysis of eWAT from DIO mice after 5 days of vehicle or TubA treatments (n= 6; Ppara P=0.0091, Me1 P=0.013, Fabp4 P=0.022, Fasn P=0.026, Leptin P=0.029, Pparg P=0.030, Arg1 P=0.0070, Chil3 P=0.032). i-l, DIO mice were placed into metabolic chambers and treated with vehicle or TubA for 5 consecutive days. i, Average daily food intake (P=3.9E-4), j, change in body weight (P=5.9E-4), k, respiratory quotient (RQ, Dark P=0.041), and l, energy expenditure (EE) during the treatment period (n=6, Veh; n=5, TubA). *P<0.05, **P<0.01, ***P<0.001 as analyzed by two-way analysis of variance (ANOVA) with Sidak’s correction for multiple comparison or two-tailed Student’s t-test. Data are represented as mean ± s.e.m.

