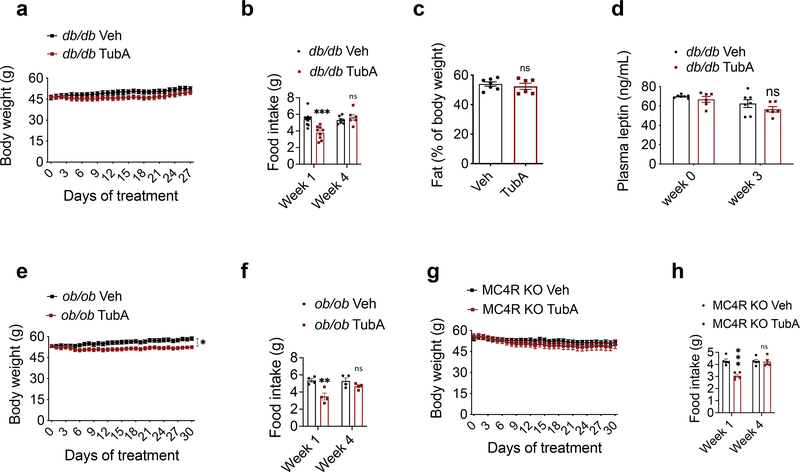
Fig. 4. Tubastatin-induced weight loss requires leptin-melanocortin signaling.
a, b, Body weight curves and food intake of daily vehicle or tubastatin-treated db/db mice (n=13 mice, Veh; n=12 mice, TubA; week 1 food intake P=1.2E-4). c, Body fat percentage of the db/db mice after three-week treatment (n=7, Veh; n=6 mice, TubA). d, Plasma leptin concentration of db/db mice measured by ELISA before and three-week after vehicle (n=7) or tubastatin (n=6) treatments. e, f, Body weight curves and food intake of daily vehicle or tubastatin-treated ob/ob mice (n=8, body weight P=0.015, week 1 of food intake 1.7E-3). g, h, Body weight curves and food intake of vehicle or tubastatin-treated MC4R KO mice (n=7, week 1 of food intake P=5.9E-5). *P<0.05, **P<0.01, ***P<0.001 as analyzed by mixed-effect analysis a, two-way ANOVA (b, d-h) with Sidak’s correction for multiple comparison or student’s t-test (c). Data are represented as mean ± s.e.m.

