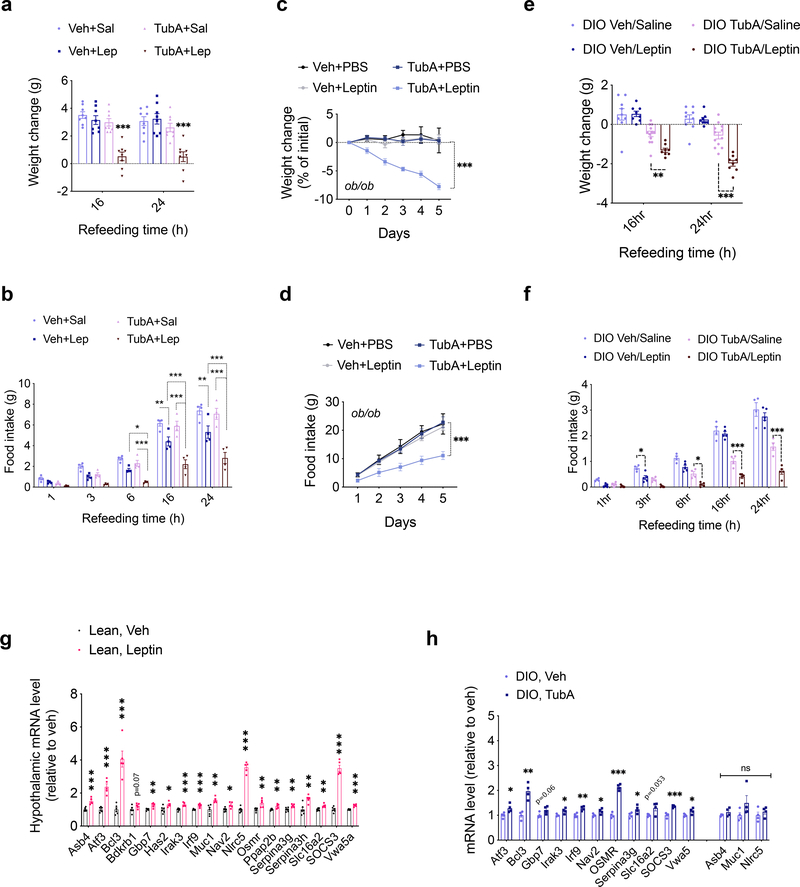
Fig. 5. Inhibition of HDAC6 leads to increased leptin action.
a, b, Food intake (TubA+Sal vs. TubA+Lep 16h P=5.1E-6, 24h P=8.6E-5) and body weight change (6h Veh+Lep vs. TubA+Lep P=0.044, TubA+Sal vs. TubA+Lep P=7.1E-4; 16h Veh+Lep vs. TubA+Lep P=3.8E-5, TubA+Sal vs. TubA+Lep P=1.1E-10; 24h Veh+Lep vs. TubA+Lep P=3.E-6, TubA+Sal vs. TubA+Lep P=2.1E-11) of 24h-fasted lean wild-type mice upon treatment with vehicle, saline, TubA (25 mg/kg) and/or leptin (2.5 mg/kg) (n= 8 per group). c, d, Cumulative food intake (Veh+Lep vs. TubA+Lep P=2.1E-4, TubA+PBS vs. TubA+Lep P=1.9E-5) and body weight change intake (Veh+Lep vs. TubA+Lep P=2.0E-13, TubA+PBS vs. TubA+Lep P=3.5E-11) of ob/ob mice (n= 4–6) treated with vehicle+saline (n=6 mice), Vehicle+leptin (0.2 mg/kg) (n=6), TubA (25 mg/kg)+saline (n=5) or TubA+leptin (n=6) following 5 day vehicle or tubastatin pre-treatments. *P<0.05, **P<0.01, ***P<0.001 as analyzed by two-way ANOVA (a-c) or mixed-effect analysis (d) with Sidak’s correction or Tukey’s post-hoc test for multiple comparison. e, f, Food intake (3h Veh/Saline vs. Veh/Leptin P=0.048; 16h TubA/Saline vs. TubA/Leptin P=2.0E-4, 24h TubA/Saline vs. TubA/Leptin P=6.9E-9) and body weight change (for TubA/Saline vs. TubA/Leptin: 16h P=6.8E-3, 24h P=1.6E-6) of 24h-fasted DIO wild-type mice upon treatment with vehicle, saline, TubA (25 mg/kg) and/or leptin (5 mg/kg) (n= 8 mice for Veh/Saline, Veh/Leptin, and TubA/Leptin, n=12 mice for TubA/Saline). g, Hypothalamic mRNA expression of the indicated genes in lean wild-type mice 4h after i.p. vehicle (n=6) or leptin (5 mg/kg, n=5) administration (Asb4 P=3.8E-4, Atf3 P=4.1E-5, Bcl3 P=8.9E-5, Bdkrb1 P=0.073, Gbp7 P=3.0E-3, Has2 P=0.023, Irak3 P=7.8E-4, Irf9 P=5.1E-4, Muc1 P=3.3E-3, Nav2 P=0.014, Nlrc5 P=3E-8, Osmr P=6.7E-3, Ppaap2b P=5.9E-3, Serpina3g P=6.7E-3, Serpina3h P=4.2E-3, Slc16a2 P=3E-3, SOCS3 P=2.7E-7, Vwa5a P=3.6E-5). h, Hypothalamic mRNA expression of the leptin-regulated genes in DIO wild-type mice 4h after vehicle or tubastatin administration (n=4; (Atf3 P=0.031, Bcl3 P=1.7E-3, Gbp7 P=0.062, Irak3 P=0.023, Irf9 P=4.2E-3, Nav2 P=0.042, Osmr P=7.5E-6, Serpina3g P=0.047, Slc16a2 P=0.053, SOCS3 P=5.7E-4, Asb4 P=0.18, Muc1 P=0.17, Nlrc5 P=0.41). *P<0.05, **P<0.01, ***P<0.001 as analyzed by Student’s t-test. Data are represented as mean ± s.e.m.

