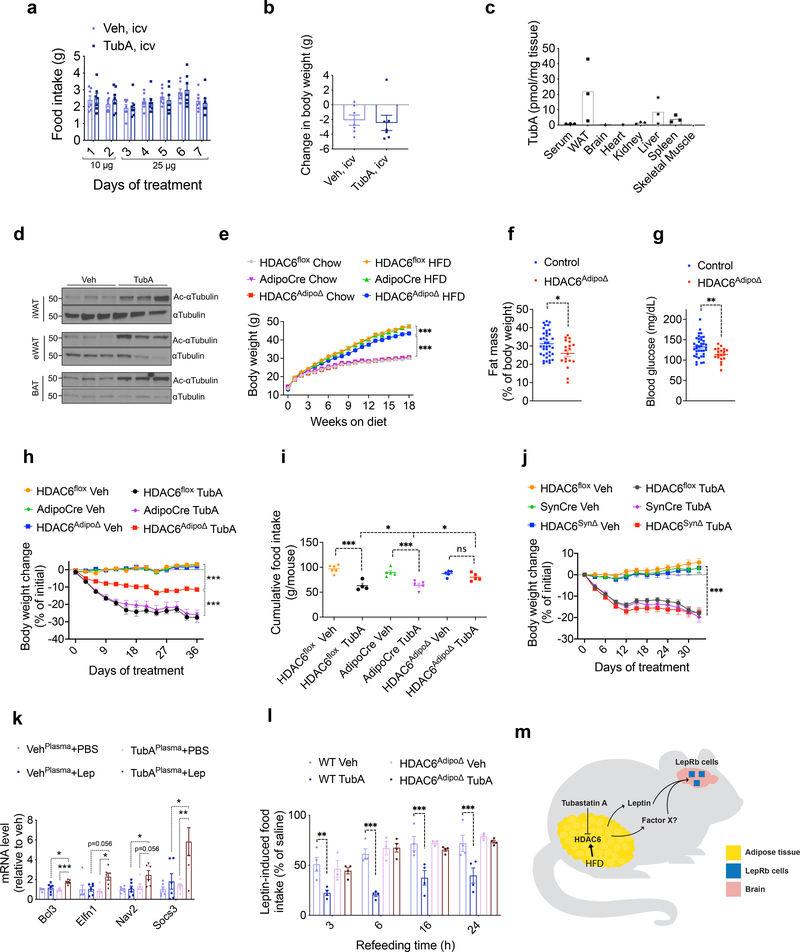
Fig. 6. HDAC6 regulates body weight in a cell non-autonomous manner.
a, b, Daily food intake and body weight change of DIO wild-type mice treated with the indicated doses of tubastatin (n= 7) or vehicle (DMSO, n= 7) by daily infusion into the lateral ventricle. c, Biodistribution of TubA in indicated tissues and serum collected 2 h post i.p. drug injection (n= 3). WAT is epididymal white adipose tissue. d, Immunoblots of acetylated αTubulin (Ac-αTubulin) and total αTubulin in the inguinal white adipose tissue (iWAT), epididymal WAT (eWAT) and intrascapular brown adipose tissue (BAT) of vehicle or tubastatin-treated wild-type DIO mice. The results were repeated in two independent experiments. e, Growth curves of regular diet-fed control (HDAC6flox (n=20 chow, n=20 HFD and AdipoCre (n=18 chow, n=18 HFD) and HDAC6AdipoΔ mice (n=14 chow, n=19 HFD; HDAC6AdipoΔ HFD vs. AdipoCre HFD P=1.0E-4; HDAC6AdipoΔ HFD vs. HDAC6AdipoΔ Chow P=3.3E-10). f, Body fat composition of control (n=38) and HDAC6AdipoΔ (n=19) mice on HFD (P=0.011, unpaired, two-tailed t-test). g, Day-time fasting (6h) blood glucose of HFD-fed control (n=38) and HDAC6AdipoΔ (n=19) mice (P=0.0047 by two-tailed t-test. *P<0.05, **P<0.01, ***P<0.001 as analyzed by Student’s t-test. h-j, Change in body weight (HDAC6AdipoΔ Veh vs. HDAC6AdipoΔ TubA P=4.9E-10; HDAC6flox Veh vs. HDAC6flox TubA P=2.6E-10, AdipoCre Veh vs. AdipoCre TubA P=2.6E-10, HDAC6AdipoΔ TubA vs. AdipoCre/HDAC6flox TubA P=2.6E-10) and (h) cumulative food intake (HDAC6AdipoΔ Veh vs. HDAC6AdipoΔ TubA P=0.73; HDAC6flox Veh vs. HDAC6flox TubA P=1.3E-5, AdipoCre Veh vs. AdipoCre TubA P=4.2E-4, HDAC6AdipoΔ TubA vs. AdipoCre/HDAC6flox TubA P=0.04) (i) of HDAC6AdipoΔ mice (n=10 mice. HDAC6flox Veh; n=9 mice HDAC6 flox TubA; n=9 mice, AdipoCre Veh; n=9 mice, AdipoCre TubA;;n=8 mice, HDAC6AdipoΔ Veh; n=10 mice, HDAC6AdipoΔ TubA) (h), and weight change of HDAC6SynΔ mice (n=10 mice, HDAC6 flox Veh; n=10 mice, HDAC6flox TubA; n=8 mice, SynCre Veh; n=7 mice, SynCre TubA, n=8 mice, HDAC6SynΔ Veh, n=8 mice, HDAC6SynΔ TubA; for all genotypes Veh vs TubA P=2.7E-10) (j) and their respective controls during daily vehicle or tubastatin treatments. k, Expression of the leptin responsive transcripts in N1-LRb cells pre-treated with plasma from vehicle or TubA-treated ob/ob mice for 2h, followed by leptin (2 ng/mL) stimulation for 4h (n=6; TubAPlasma+PBS vs. TubAPlasma+Lep: Bcl3 P=9.4E-4, Elfn1 P=0.023, Nav2 P=0.056, Socs3 P=0.0052). l, 24hr fasted lean wild-type or HDAC6AdipoΔ mice were treated with leptin or saline alone or in combination with TubA. The food intake during refeeding were plotted as percent intake of the saline groups (n=4 for all groups except HDAC6AdipoΔ Veh, where n=3. wt Veh vs. wt TubA: 3h P=2.2E-3, 6h P=1.3E-5, 16h P=2.2E-4, 24h P=5.0E-4; wt TubA vs. HDAC6AdipoΔ Tub: 3h P=0.025, 6h P=7.3E-7, 16h P=2.8E-3, 24h P=2.6E-4). See also Extended Data Fig. 9f, g. m, Illustration summary: HFD induces and tubastatin suppresses HDAC6 activity in the adipose tissue. Inhibition of HDAC6 activity leads to central leptin sensitization through a potentially novel adipokine (Factor X).
*P<0.05, **P<0.01, ***P<0.001 as analyzed by mixed-effect analysis (e-i) or one-way (j) or two-way ANOVA (k, l) with Tukey’s post-hoc test for multiple comparison. Data are represented as mean ± s.e.m.

