Fig. 1.
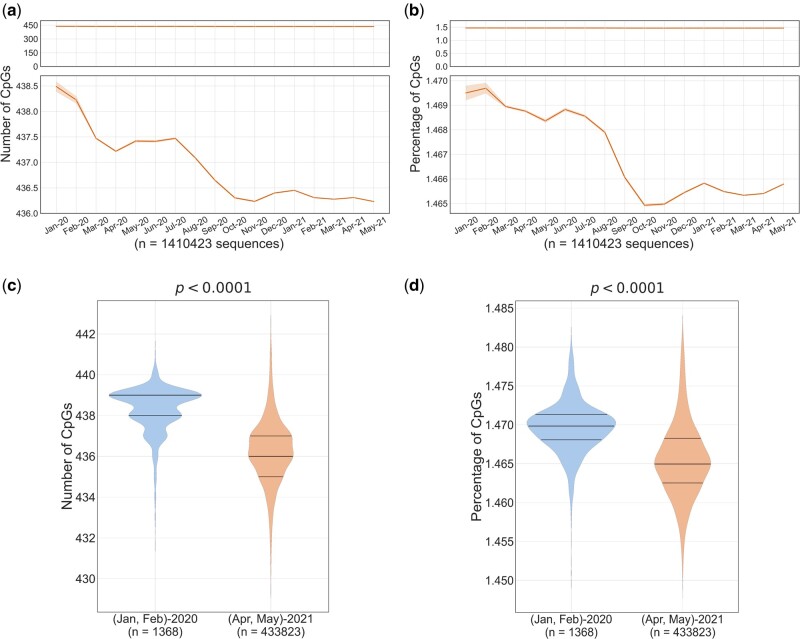
Temporal analysis of CpG content in complete SARS-CoV-2 genomes: full-length sequences of SARS-CoV-2 (n = 1,410,423) were grouped month-wise based on the date of sample collection. Line graphs indicate the monthly mean of (a) the number of CpGs and (b) the percentage of CpGs (normalized to the length of the genome). The line plots in the upper panel show almost a flat line indicating only marginal change in CpG content, whereas the zoomed-in view in the lower panels show modest, but clear trend of CpG depletion. The 95% confidence intervals are represented by the orange bands. Violin plots showing the distribution of (c) CpG numbers and (d) CpG percentage of the SARS-CoV-2 genomes from samples collected in the first 2 months of the pandemic (i.e., January–February 2020) and those from the last 2 months (i.e., April–May 2021) of the timeline analyzed in this study. The median number of CpGs and the CpG percentage were significantly higher in the samples collected in the first 2 months (January–February 2020) as compared with those in the last 2 months (April–May 2021) (P < 0.0001; Mann–Whitney U test).

