Fig. 4.
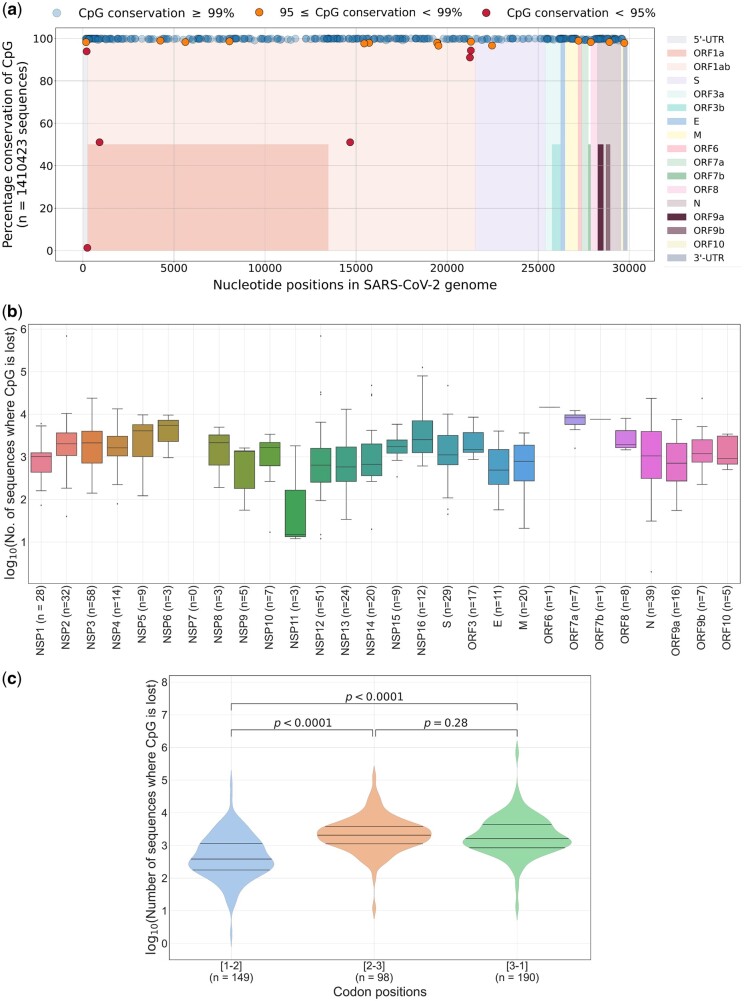
The extent of CpG depletion across genes and codon positions: (a) Graph showing the location of CpG dinucleotides in the SARS-CoV-2 (nucleotide positions are based on the WIV04 reference sequence) and their conservation across 1,410,423 complete SARS-CoV-2 genomes. Different colors are used along the x axis to indicate genes/ORFs. For overlapping ORFs, segments are colored to half the height. The graph shows that majority of the CpG dinucleotides are conserved in over 99% of the sequences analyzed. (b) Gene-wise analysis of CpG loss: the number of CpGs within each gene is indicated on the x axis. Box-and-whiskers plots show the gene-wise distribution of sequences that lost CpG dinucleotide(s). Outliers are shown as black dots. The extent of CpG depletion varies greatly within and across genes. (c) CpGs within coding regions of SARS-CoV-2 are grouped on the basis of codon positions. The loss of CpGs at codon positions 2-3 and 3-1 is more pronounced than that at codon position 1-2. The Mann–Whitney U test was used to compare the medians in the violin plots. NSP, nonstructural protein; ORF, open reading frame.

