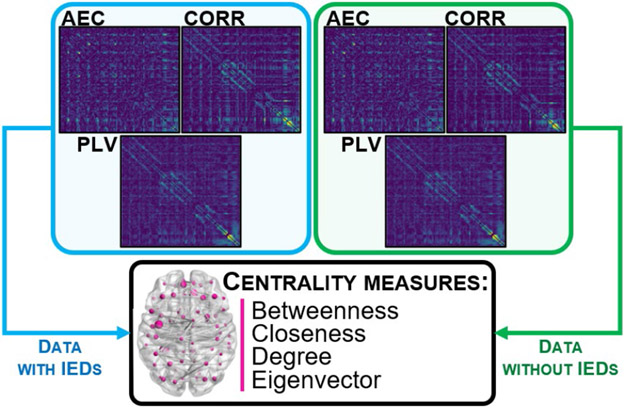
Fig. 2: Graph analysis computed on each FC matrix.
On each averaged FC matrix (AEC, CORR, PLV), computed for data with IEDs and without IEDs separately, we represented the brain of each patient as a graph by using the MST and computing its centrality measures to estimate the importance of each node (sensor) within the network.

