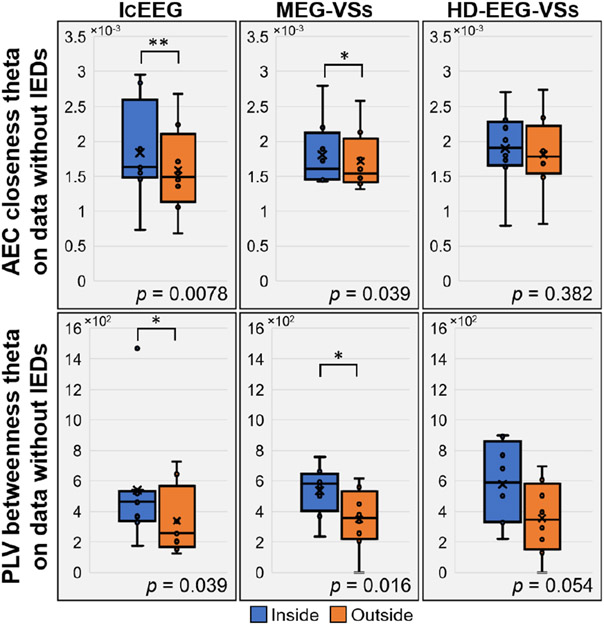
Fig. 3: Association between centrality measures and EZ.
IcEEG and MEG-VSs showed, for AEC closeness theta (top of the figure) and PLV betweenness theta (bottom of the figure), higher connectivity inside than outside resection on data without IEDs. A similar trend was observed for HD-EEG-VSs without obtaining statistical significance.

