
Table 2.
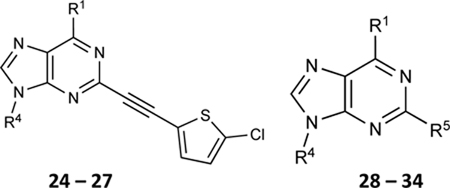
Effect of N6, C2 and riboside modifications of adenosine derivatives (both (N)-methanocarba and ribose-containing) on the ATPase activity of ABCG2
| ||||
|---|---|---|---|---|
| No. | R1 | R4 [R5] | ATPase activity of ABCG2 % Stimulation or inhibition | |
| 2.5 μMb | 10 μMb | |||
| (N)-Methanocarba derivatives | ||||
| 24 | H |

|
NE | NE |
| 25 | NHCH3 |
|
59.2±5.9 ↑ | NE |
| 26 | NH(CH2)2CH3 |
|
77.9±3.3 ↑ | 40.0±7.3 ↑ |
| 27 | NHCH3 |
|
89.1±2.1 ↑ | 79.0±8.1 ↑ |
| 28 |
|

|
NE | 36.6±0.9 ↓ |
| 29 |

|
|
97.5±23.1 ↑ | 92.9±15.1 ↑ |
| 30 |

|
|
75.2±13.8 ↑ | 54.1±8.6 ↑ |
| Ribose derivatives | ||||
| 31 |
|
|
66.2±7.3 ↑ | 98.2±5.4 ↑ |
| 4 |
|
|
100.8±5.8 ↑ | 69.9±6.0 ↑ |
| 32 | NHCH3 |
|
111.9±16.8 ↑ | 121.7±10.5 ↑ |
| 33 | NH(CH2)2CH3 |

|
124.5±3.4 ↑ | 121.7±21.2 ↑ |
| 34 | NHCH3 |
|
NE @ 100 nM | 52.2±8.7↑ @ 1 μM |
a
Modulation of the basal ATPase activity of ABCG2 by A3 adenosine receptor ligands showing percentage stimulation or inhibition. Details are the same as given in the legend to Table 1.
b
Concentrations were 2.5 and 10 μM, unless otherwise indicated.