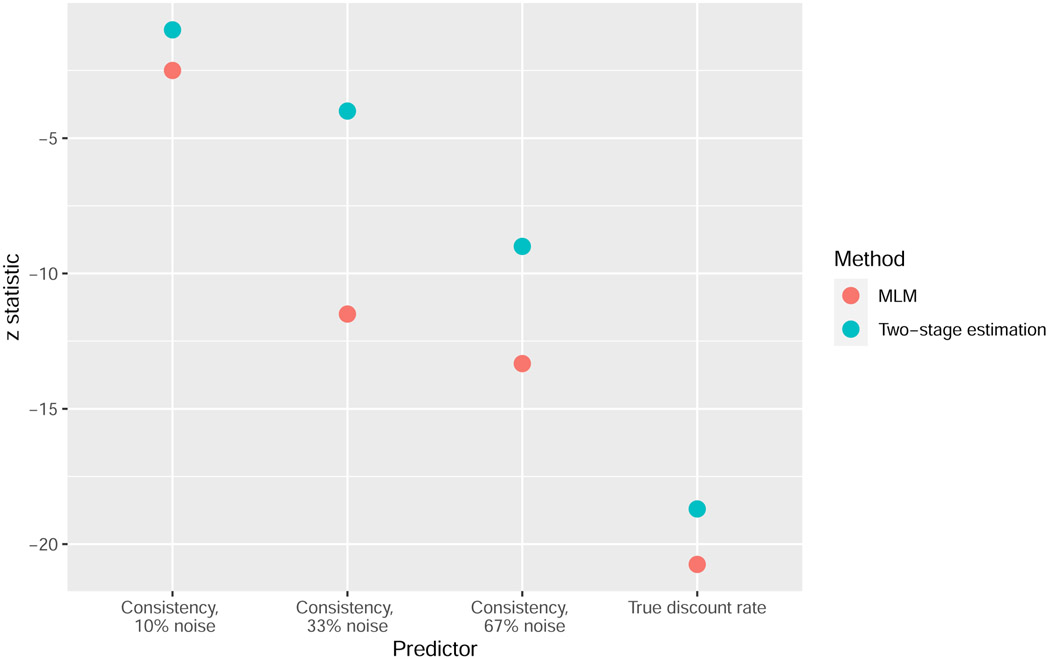
Figure 1.
Comparison of the MLM versus Two-stage estimation approaches towards recovering between-group differences in hyperbolic discount mean rates (True discount rate) and consistency at different levels of noise. Negative z values indicate that (1) the reference group had a higher true hyperbolic discount rate than the group of interest and (2) estimated consistency decreases with increasing noise.

