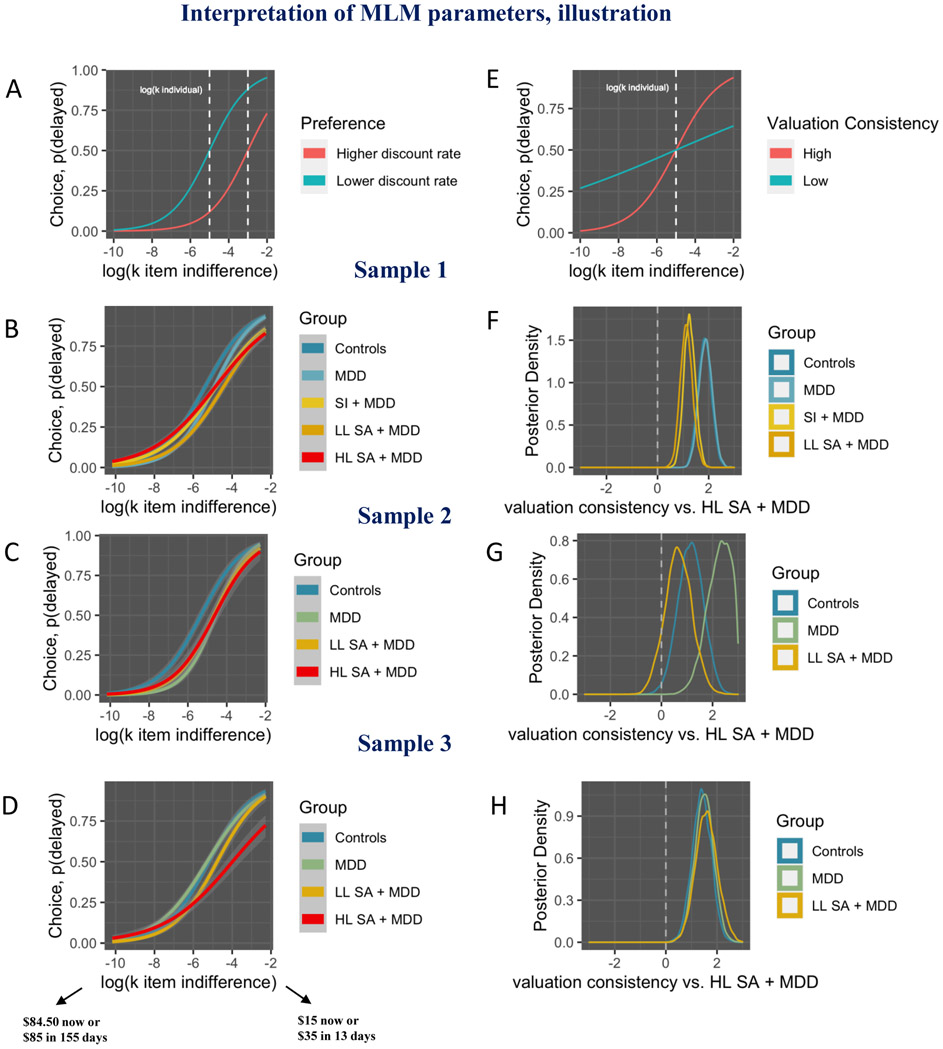
Figure 2.
A-E: immediate vs. delayed choice probabilities as a function of item-level discount rates corresponding to the indifference point , log-transformed. Lower on the x-axis correspond to the prospects where only extremely patient individuals choose the delayed option (e.g., $84.50 now or $85 in 155 days), whereas higher values on the x-axis correspond to prospects where even impatient individuals will choose the delayed option (e.g., $15 now or $35 in 13 days). Thus, if the value of a delayed option dominates, implied discount rate is higher. Conversely, if the value of an immediate option dominates, implied discount rate is lower. Probability of choosing the delayed option is on the y-axis (A-E). Psychometric curves for high vs. low MLM preference parameter values, illustration (A). Dashed vertical line illustrates log(kindividual). Psychometric curves (smoothed raw data) sample 1 (B); Psychometric curves (smoothed raw data) sample 2 (C); Psychometric curves (smoothed raw data) sample 3 (D). The inspection of psychometric curves in B-D indicates less consistent valuation (i.e., less steep psychometric curves; conceptually similar to the inverse temperature parameter) in high-lethality suicide attempters, which confirms our multilevel modeling results. Psychometric curves at high versus low valuation consistency, illustration. At high valuation consistency choices are based on the attributes of a given prospect, whereas at low valuation consistency choices are stochastic (E). White dashed vertical lines illustrate log(kindividual).
Posterior parameter distributions from Bayesian multi-level regression models (F-H). Valuation consistency sample 1 (F). Approximate 2-sided ps of all groups, compared to the HL SA + MDD group, are less than 0.001); Valuation consistency sample 2 (G). Approximate 2-sided ps, compared to the HL SA + MDD group: 0.022 in the Controls; less than 0.001 in the MDD group; 0.206 in the LL SA + MDD group; Valuation consistency sample 3 (H). Approximate 2-sided ps of all groups, compared to the HL SA + MDD group, are less than 0.001).

