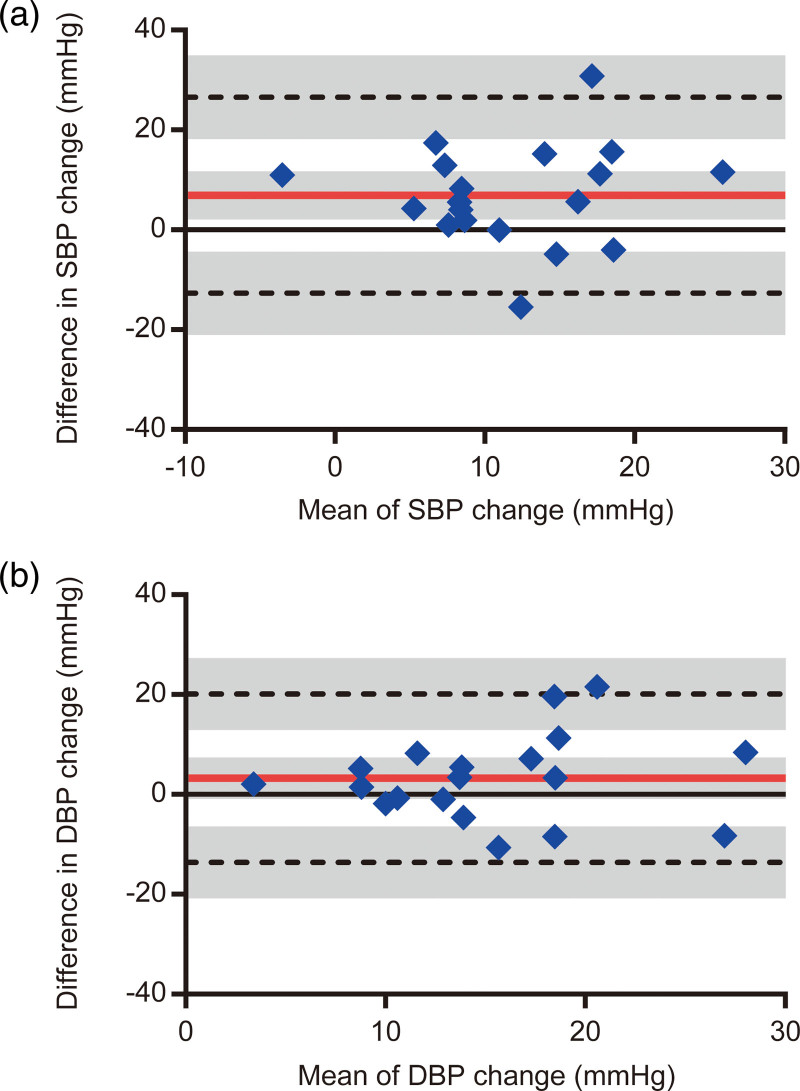
Fig. 2.
Bland-Altman plots between the sit-up and head-up tilt tests for (a) systolic blood pressure and (b) diastolic blood pressure changes. The red solid and black dashed horizontal lines represent the bias and limits of agreement, respectively. Bias was calculated by subtracting the value of the head-up tilt test from the value of the sit-up test. The gray shaded areas illustrate the 95% confidence interval for the bias and limits of agreement.

