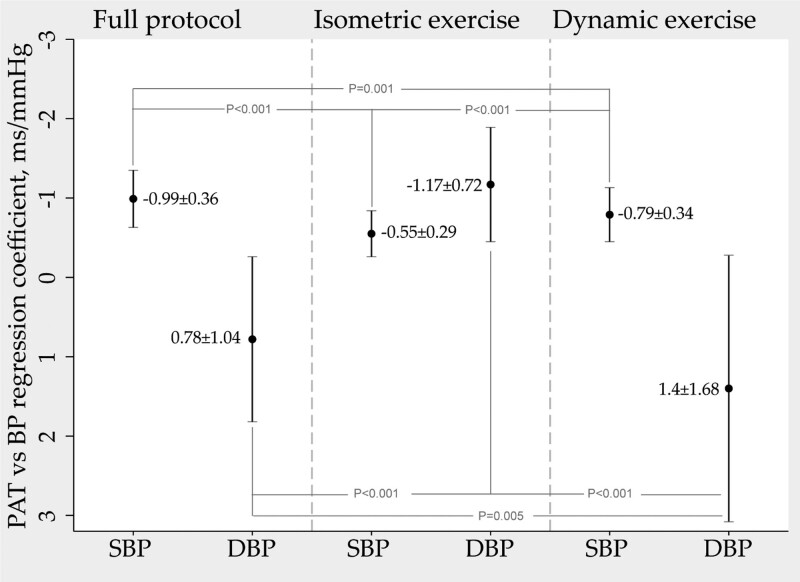
Fig. 5.
Mean ± SD of the individual regression coefficients between PAT as the dependent variable and SBP and DBP as the independent variable. The analysis was performed for the full protocol and then separately for the isometric exercise period and dynamic exercise period. The presented numerical data in the graph represents change in PAT per one-unit change in BP (ms/mmHg). PAT, pulse arrival time (ms).

