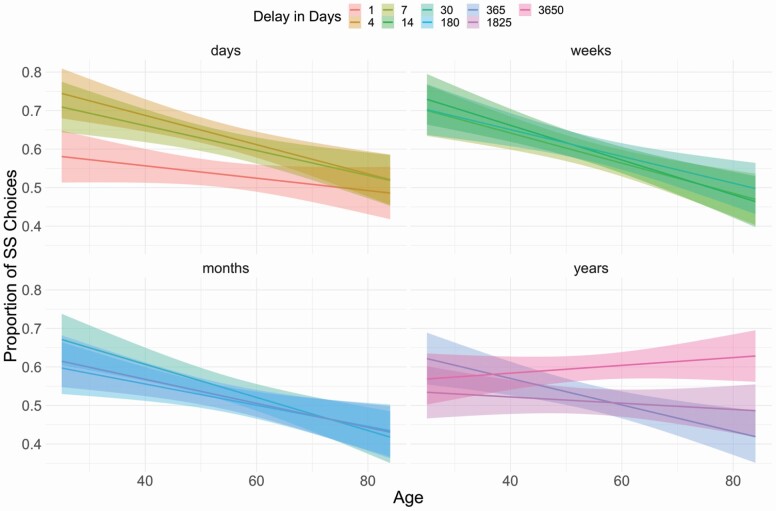
Figure 2.
Delay discounting by delay (in days) across adulthood. The proportion of sooner options chosen by age and length of delay (in days). Higher values represent more discounting. Graphs are faceted by the unit that was presented to participants (days, weeks, months, or years). The length of 7 days is shown on the Days and Weeks graph, representing data from when this length was presented to participants as 7 days (Days facet) and 1 week (Weeks facet). Similarly, 30 days appear on the Weeks (4 weeks) and Months (1 month) graphs while 365 days appear on Months (12 months) and Years (1 year) graphs. Error bars reflect the 95% confidence interval.

