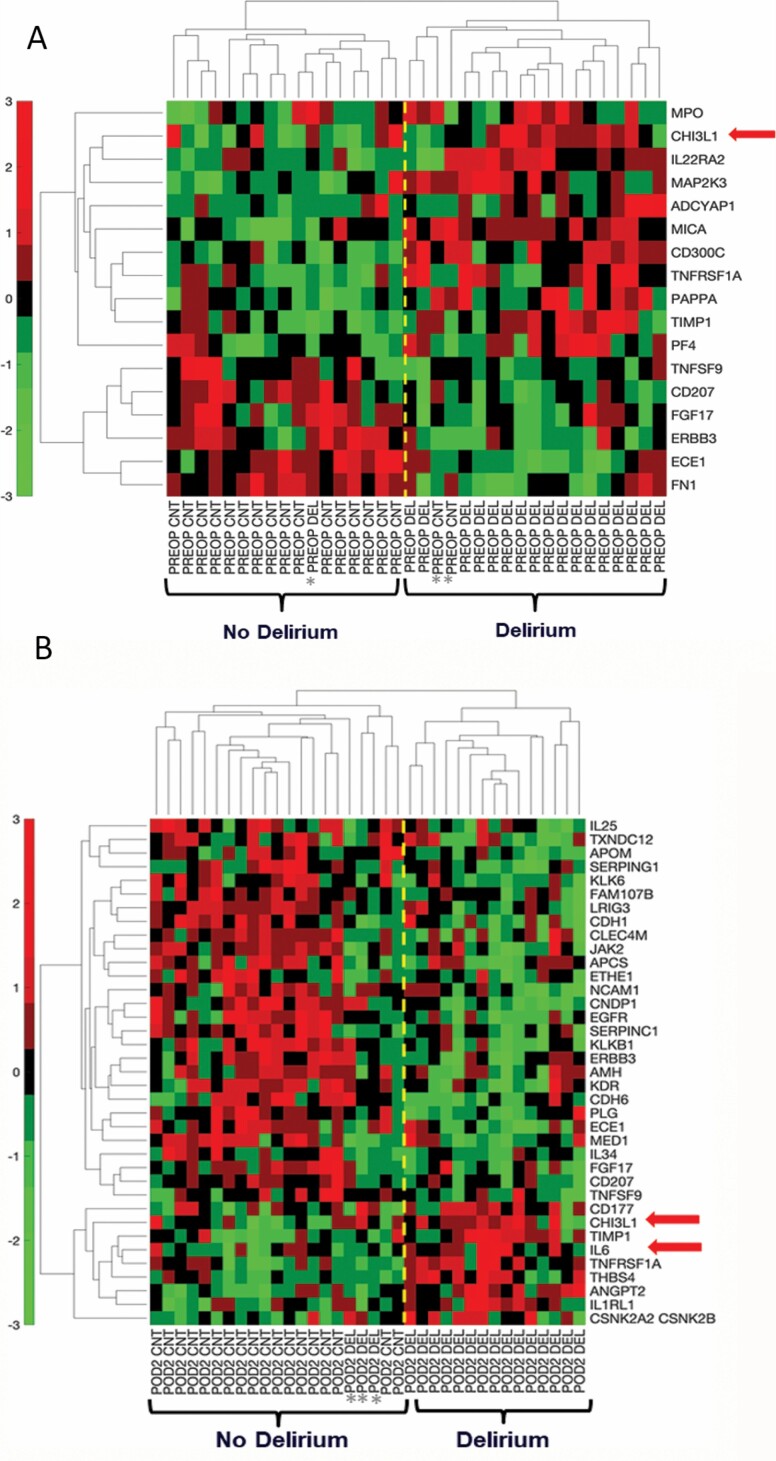
Figure 2.
Hierarchical clustering of top proteins differentially expressed between delirium cases and matched controls at PREOP and POD2. (A) Hierarchical clustering of delirium cases and matched non-delirium controls using the top 17 plasma proteins at PREOP (p < .01), reflecting relative minimum and maximum expression levels for each protein as quantified by SOMAscan. (B) Hierarchical clustering of delirium cases and matched non-delirium controls using the top 37 plasma proteins at POD2 (p < .01). In the hierarchical clustering colormap, red denotes relatively higher level and green denotes relatively lower level. CHI3L1/YKL-40 = Chitinase 3-like protein 1; IL6 = Interleukin-6; POD2 = Postoperative day 2; PREOP = Preoperative.

