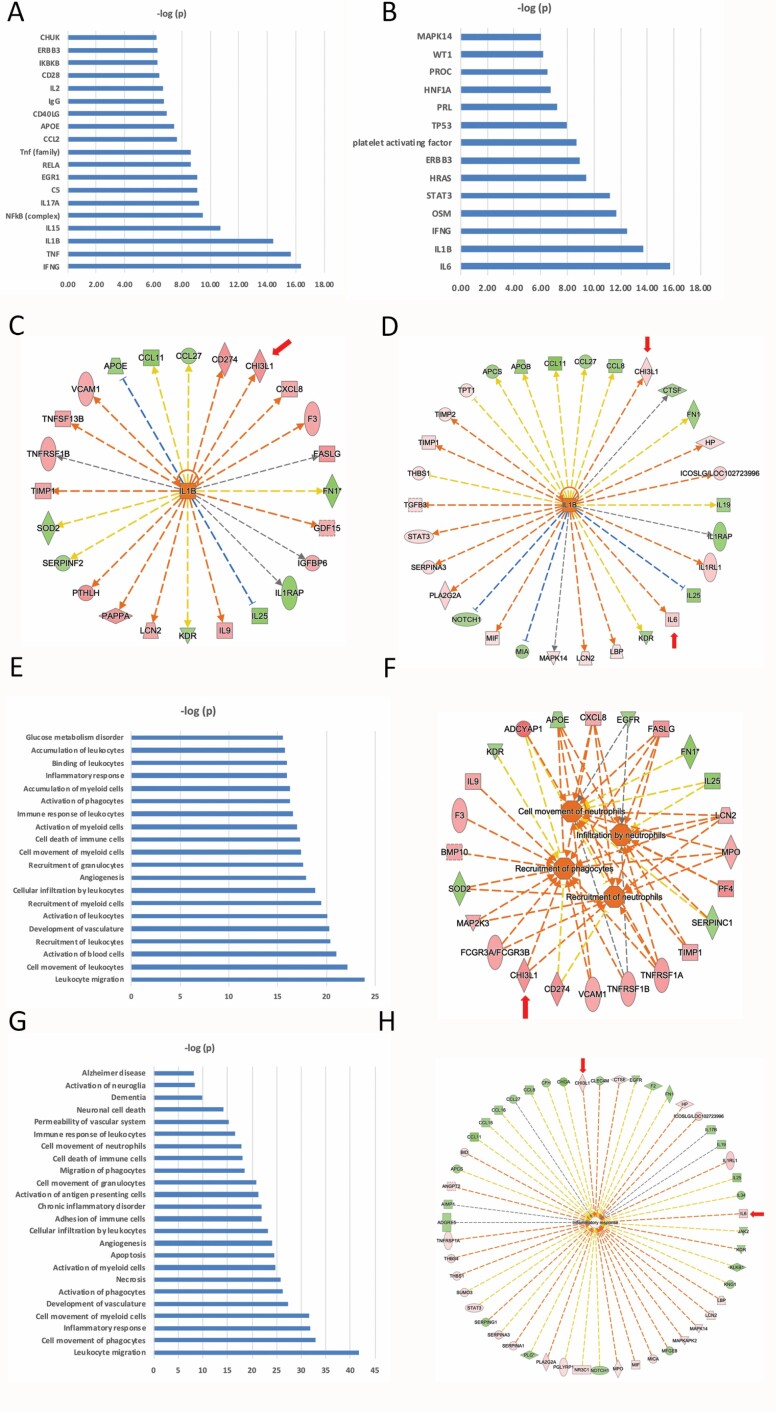
Figure 3.
(A) PREOP Upstream regulators (ie, a protein/gene that can affect the expression of another protein/gene) with highest statistical significance that best explain the observed expression changes in the input 85 protein list as their targets. The x-axis indicates the -log p-values. (B) POD2 Upstream regulators (ie, a protein/gene that can affect the expression of another protein/gene) with highest statistical significance that best explain the observed expression changes in the input 128 protein list as their targets. The x-axis indicates the -log p-values. (C) PREOP Downstream targets of IL1B (ie, proteins whose expression is affected by IL1B) from among the 85-protein list. Red indicates upregulation and green denotes downregulation in delirium. Proteins are coded by shape; square: cytokine, vertical rhombus: enzyme, horizontal rhombus: peptidase, trapezoid: transporter, ellipse: transmembrane receptor, circle: other. Links are color-coded as red: leads to activation, blue: leads to inhibition, yellow: findings inconsistent with state of downstream protein, black: effect not predicted. (D) POD2 Downstream targets of IL1B (ie, proteins whose expression is affected by IL1B) from among the 128-protein list. The color, shape, and link coding are the same as part C. (E) PREOP Biological functions that are significantly enriched (ie, statistically relative high number of proteins dysregulated in cases versus controls) by the 85-input protein list. The x-axis indicates the -log p-values. (F) PREOP proteins among the input list that are linked to immune cell movement. The color, shape, and link coding are the same as part C. (G) POD2 Biological functions that are significantly enriched by the 128-input protein list. The x-axis indicates the -log p-values. (H) POD2 proteins among the input list that are linked to the “Inflammatory Response” biological functions. The color, shape, and link coding are the same as part B. In parts B and D, proteins that are validated by ELISA are indicated by a red arrow. The orange color of the target upstream regulator and biological function shown in the center implies ‘‘activation,’’ and the shade of the color implies confidence in activation with darker shades implying more confidence in the prediction. See text for more details. ELISA = enzyme-linked immunosorbent assay, POD2 = postoperative day 2, PREOP = preoperative.

