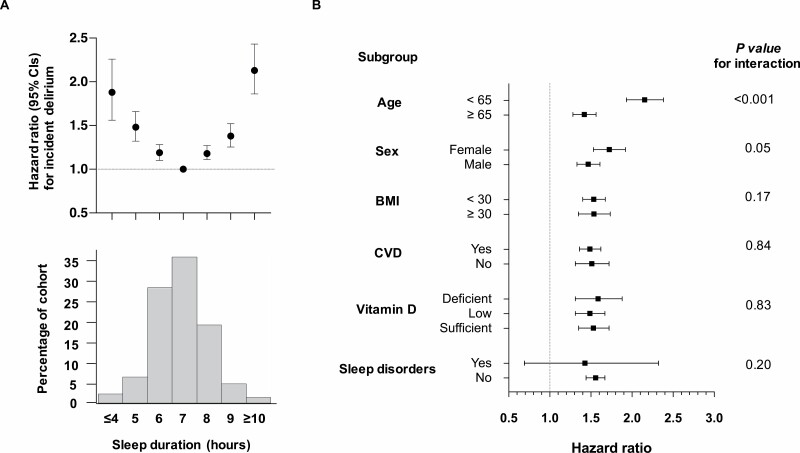
Figure 2.
Subgroup analysis of delirium risk. (A) Delirium risk by hourly sleep duration shows a U-shaped profile (adjusted for age, sex, education, ethnicity, and deprivation). (B) Forest plot of hazard ratios and 95% confidence intervals for moderate/severe sleep burden (vs none/minimal), predicting incident delirium based on subgroups of participants by age, sex, BMI, CVD risk, vitamin D levels, and presence of any sleep disorder. BMI = body mass index; CVD = cardiovascular disease.

