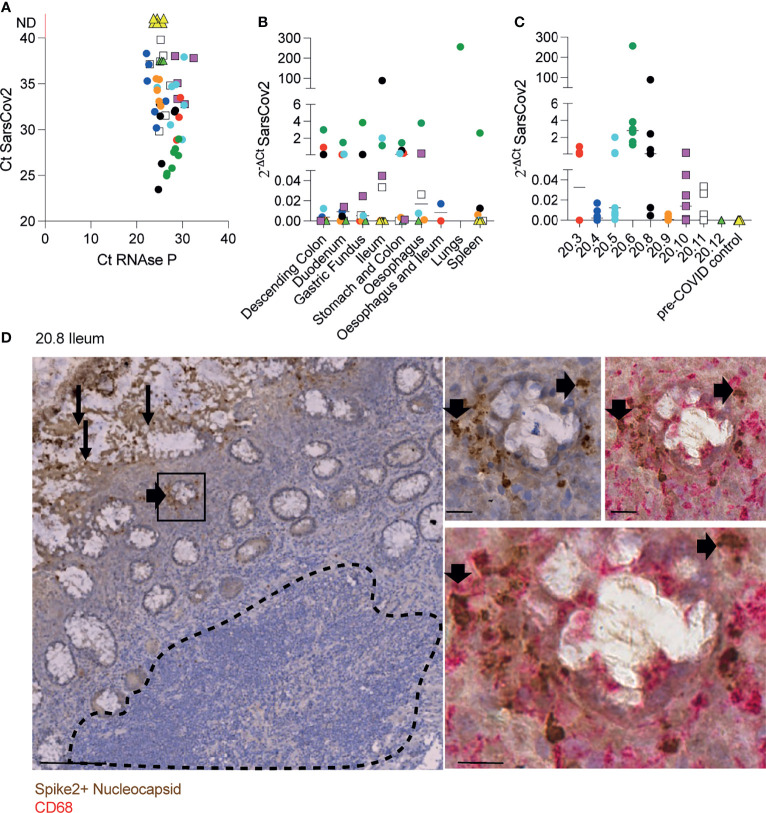
Figure 1.
Identification of SARS-CoV-2 in tissue samples along the GI tract. (A-C) Evaluation of SARS-CoV-2 presence using RT-qPCR in different FFPET samples from 9 COVID-19 deceased patients and 4 pre-COVID patients used as controls. Dots represent the viral RNA level from each sample and were coloured by patient. The lines represent the median values per organ (B) or patient (C). (D) IHC for SARS-CoV-2 spike and nucleocapsid proteins in an ileal sample from patient 20.8 showing the virus presence in the epithelium (panel on the left) and sub-mucosal macrophages (panels on the right). Scale bar for image on the left: 100μm. Sale bars for images on the right: 20μm. The dashed line delimitates the GALT.

