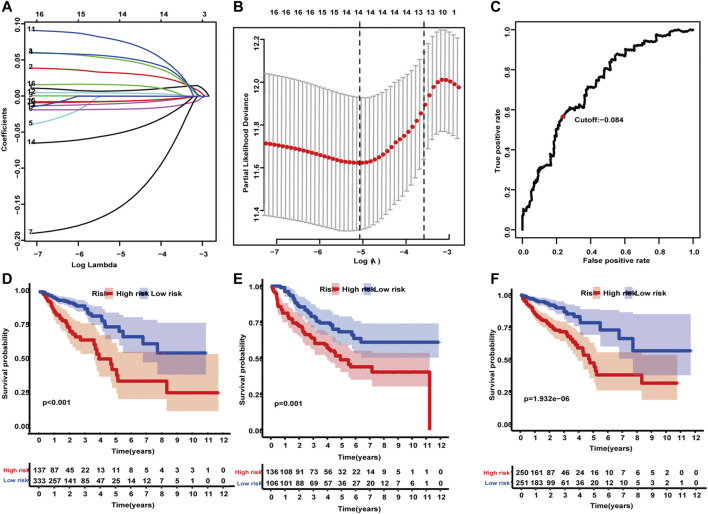
FIGURE 2.
Construction and validation of an IRG predictive model. (A) Tenfold cross-validation for tuning parameter selection in the LASSO model using minimum criteria. (B) LASSO coefficient profiles of the 17 IRGs. A vertical line was drawn at the value selected using 10-fold cross-validation, where the optimal lambda resulted in 14 nonzero coefficients. (C) The optimal cutoff value was determined. (D–F) The Kaplan–Meier method applying the two-sided log-rank test was performed to estimate differences in OS between high- and low-risk groups in the training, test, and validation cohorts.

