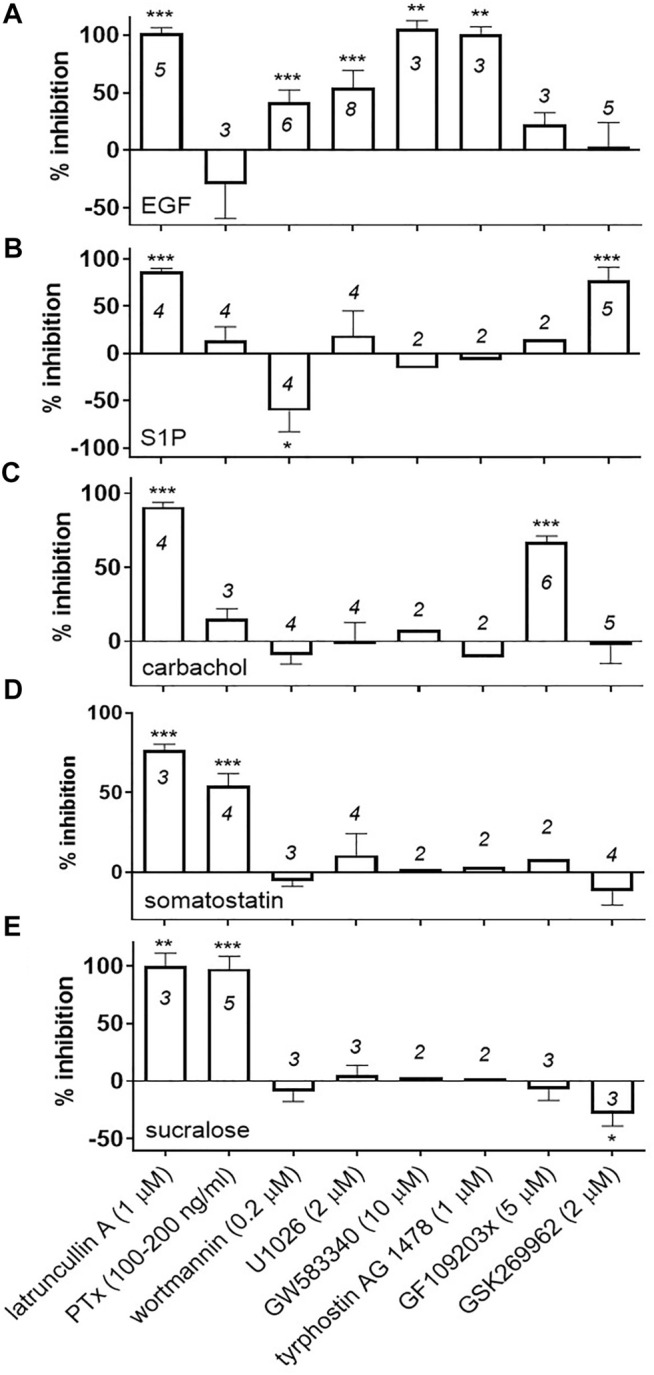
FIGURE 3.

Effect of pathway blockers on agonist-mediated DMR responses in R2/R3 U2OS cells. Cells were equilibrated at room temperature for 90 min in the Epic® reader with the indicated concentrations of pathway blockers or latrunculin A. In the case of PTx, cells were incubated over night at 37°C and on the day of the experiment PTx was replaced with buffer and cells were equilibrated in the Epic® reader as described above. A 5x-concentrated stock of agonist was then added onto the cells and DMR responses were recorded as described in Materials and Methods. Final concentrations of agonist were 2 mM sucralose (E), 10 μM somatostatin (D), 100 μM carbachol (C), 1 μM S1P (B) and 100–300 ng/ml EGF (A). Two to eight independent experiments were conducted with each blocker (number of independent experiments are indicated on the bar graph). For the experiments conducted with sucralose, a % inhibition was calculated for each pathway blocker using an assay window defined by the peak DMR value of the sucralose response alone measured on R2/R3 U2OS cells (0% inhibition) and the sucralose response measured on parental cells (100% inhibition). Alternatively, for the remaining agonists a % inhibition was calculated for each pathway blocker using an assay window defined by the peak DMR value of the agonist response alone measured on R2/R3 U2OS cells (0% inhibition) and a buffer stimulation on R2/R3 U2OS cells (100% inhibition). A mean and standard deviation was calculated and a one sample t-test (α = .05) was conducted for each blocker with N ≥ 3, determining if the mean inhibition was different than 0% (***p < .001, **p < .01, *p < .05). Representative DMR traces are shown in Supplementary Figure S1.
