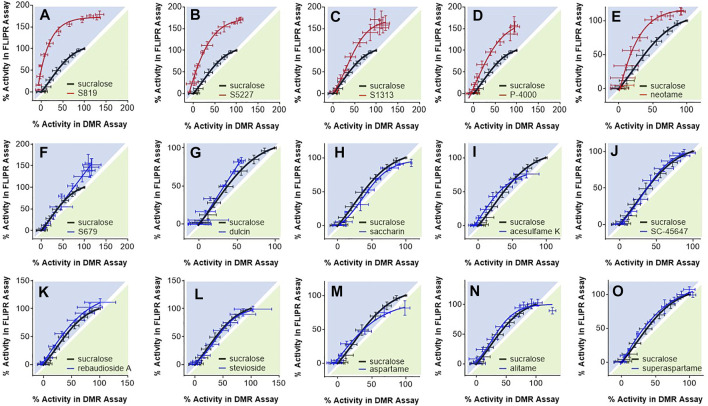
FIGURE 5.
Bias plotting analysis. Depicted agonists [panels (A–O)] were evaluated at equimolar concentrations in the DMR assay with R2/R3 U2OS cells and in the FLIPR assay with R2/R3 U2OS cells expressing Gα15. Assay data was normalized to responses obtained with 1 mM sucralose and resulting activity values were plotted on the same graph. Each data point corresponds to an average and standard deviation from values generated in 3 to 21 independent experiments performed in triplicate.

