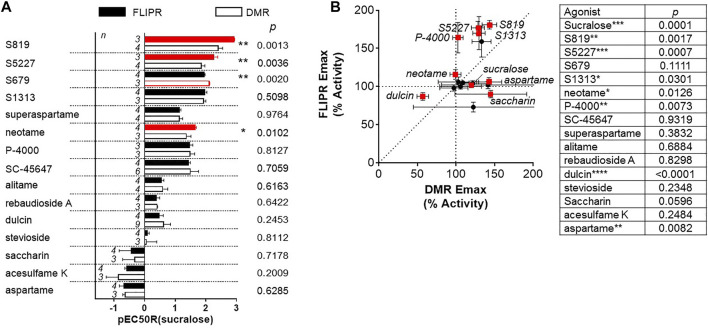
FIGURE 6.
Potency and efficacy bias analysis. (A) Agonist potency values (pEC50s) obtained in each assay were normalized to that of sucralose as described in Materials and Methods. Each pair of the resulting values (pEC50R(sucralose)) were then analyzed by an unpaired, t-test (α = .05). (B) Agonist efficacy (Emax) values obtained in each assay were and summarized in Table 1 were plotted against each other. Each pair of Emax values were analyzed by an unpaired, t-test (α = .05) (***p < 0.001, **p < .01, *p < .05).

