FIGURE 9.
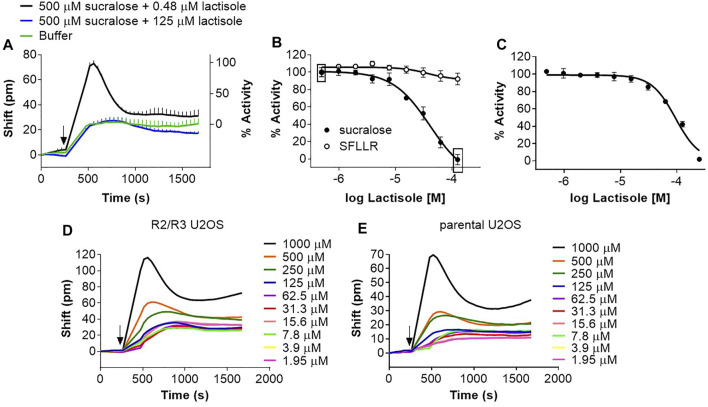
Evaluation of a NAM for the human sweet taste receptor in the DMR and FLIPR assays. (A) R2/R3 U2OS cells were stimulated with a fixed concentration of sucralose (500 μM) and with increasing concentrations of lactisole and DMR responses were monitored on the Epic® reader. Depicted are the kinetics corresponding to the effect of 0.48 μM and 125 μM lactisole on the sucralose effect. (B) Depiction of the full lactisole dose-responses analysis of the experiment described in (A). The rectangle includes data points from which the kinetics in Panel A were taken. (C) R2/R3 U2OS cells were transduced with Gα15 baculovirus. After 48 hours, cells were loaded with Fluo4 and stimulated with a fixed concentration of sucralose (500 μM) with increasing concentrations of lactisole and responses were monitored on the FLIPR. Curves in (B,C) are representative of three independent experiments and data points correspond to an average and standard deviation of a triplicate determination. (D) Effect of increasing concentrations of lactisole on R2/R3 U2OS cells’ basal DMR response. Kinetics are representative of three independent experiments. (E) Effect of increasing concentrations of lactisole on parental U2OS cells’ basal DMR response. Kinetics are representative of three independent experiments.

