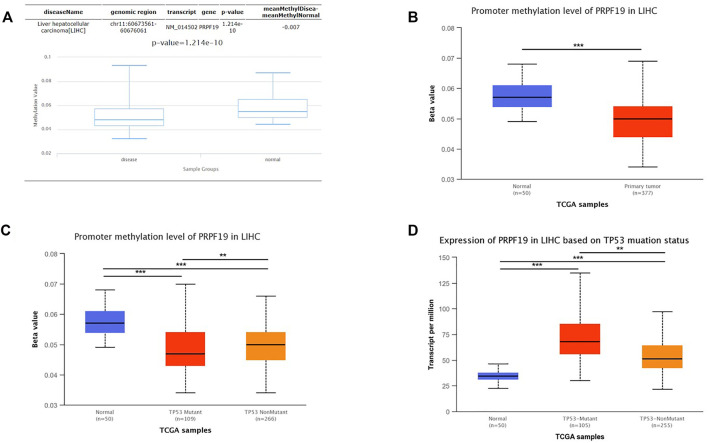
FIGURE 7.
Analysis of the relationship between PRPF19 expression and promoter methylation level of PRPF19 and TP53 alteration statue. (A) Differential analysis of methylation value between LIHC and Control via DiseaseMeth. (B) Differential analysis of between LIHC and Control via UALCAN. (C) Correlation between promoter methylation level of PRPF19 between TP53 statue. (D) Differential analysis of PRPF19 expression between wild-type TP53 wild-type and mutated TP53.

