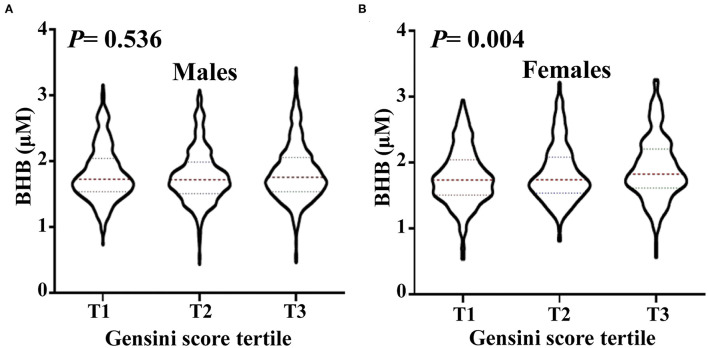
Figure 3.
The level of circulating BHB in men and women, respectively, according to Gensini score tertile. Violin plots of serum BHB concentrations in men (A) and women (B) by Gensini score tertile, showing median (red dashed line) and interquartile ranges (blue dashed line) on a log10 scale. The p < 0.05 considered statistically significant.

