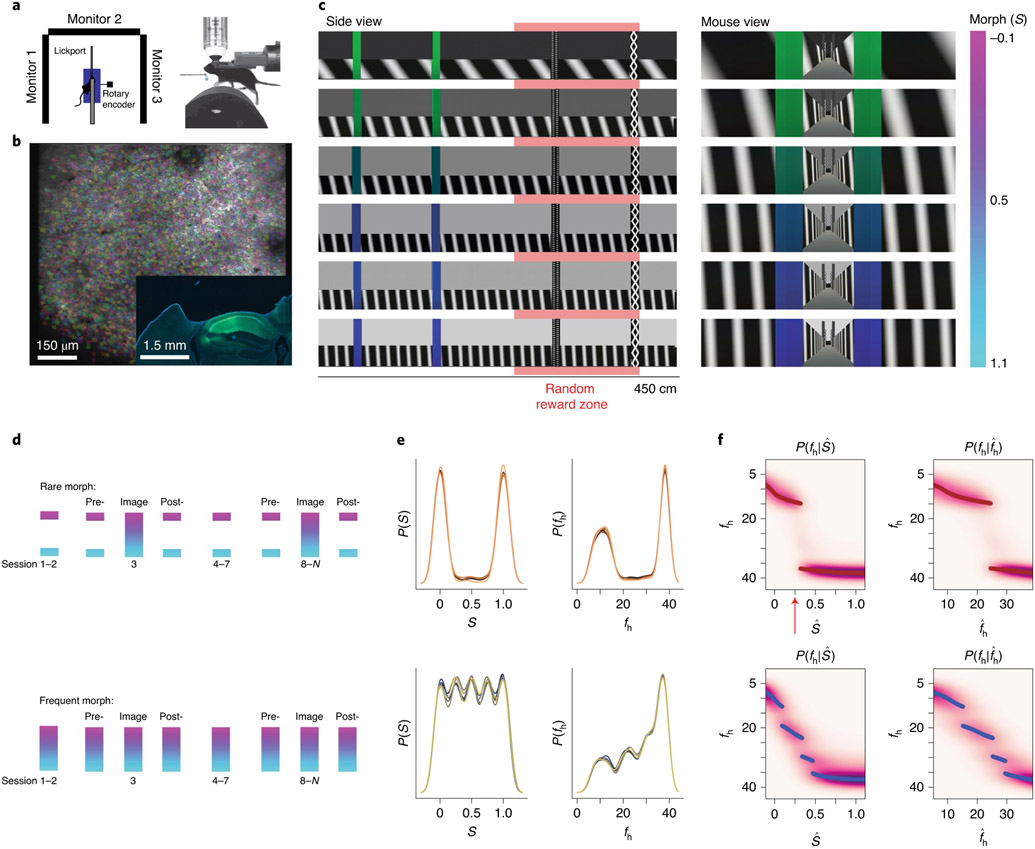
Fig. 1 ∣. VR setup for imaging CA1 neurons and the construction of priors for rare morph versus frequent morph conditions.
a, Top view (left) and side view (right) of the VR setup, b, Example FOV from an imaging session (mouse F2, session 12; λ = 920 nm) with identified CA1 neurons highlighted (n = 2,006 cells). Inset shows coronal histology for the same animal (green, GCaMP; blue, DAPI (4,6-diamidino-2-phenylindole)). c, The stimulus desig,n with example linear tracks for different morph (S) values (the color bar on the far right indicates S value). Left: side view of VR tracks; the red bar indicates a random reward zone (250–400 cm). Right: view from the perspective of the mouse. d, Illustration of the training protocol for the rare morph (top; n = 6 mice, R1–R6) and the frequent morph (bottom; n = 6 mice, F1–F6) conditions. Imaging was performed on sessions 1, 3 and 8–N (Extended Data Fig. 2f,g). For the rare morph condition, only extreme morph values were shown during trials before imaging begins (pre-) and after imaging ends (post-). For the frequent morph condition, intermediate morph values were shown on each session. Note that for a given trial, morph values were randomly interleaved according to the training condition, e, Left: the empirical prior distribution over the morph values, P(S), at the beginning of session 8 for mice in the rare morph group (top; R1–R6) and the frequent morph group (bottom; F1–F6). Colors indicate mouse ID. Right: same as the left, but after converting morph values to horizontal wall frequency fh (cycles per 500 cm). f, Heatmap of the probability mass function of the posterior probability for each value of (left) and (right). MAP estimates are plotted as maroon (rare; top) or blue (frequent; bottom) points. Note that if CA1 population activity approximates this form of probabilistic inference, the population activity in the rare morph condition will change abruptly when S is between 0.25 and 0.5 (as indicated by the red arrow). Rare morph and frequent morph activity could appear largely similar outside this range of stimuli.

