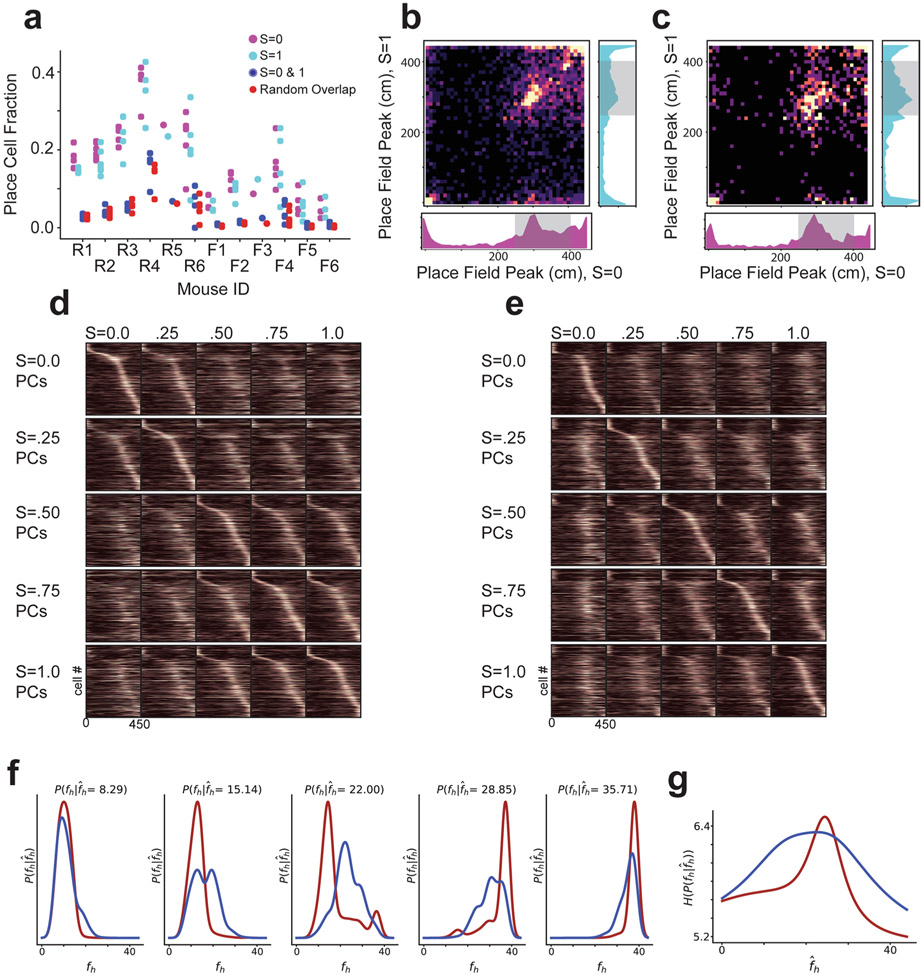
Extended Data Fig. 4 ∣. Analysis of place cells with place fields in both and environments, and analysis of posterior distribution entropy.
a, Fraction of cells classified as place cells in the trials (magenta), trials (cyan), and both and trials (intersection of the sets of cells; navy). The number of cells expected to be classified as place cells in both environments if cells were chosen randomly with replacement is also shown (red). b, For cells that were classified as place cells in both and trials (n = 2,219 cells) in rare morph animals, we plotted the location of peak activity for trials against the location of peak activity for trials. Marginal histograms are shown for occupancy of position bins in the trials (bottom) and trials (right). Shaded regions indicate possible reward locations. c, Same as (b) for all frequent morph animals (n = 594 cells). d, Same as Fig. 2b (rare morph condition) but only cells that had place fields in both and trials are plotted (n = 2,219 cells). e, Same as Fig. 2d (frequent morph condition) but only cells that had place fields in both and trials are plotted (n = 594 cells). f, Example posterior distributions (rare morph-maroon, frequent morph-blue) for different values of (that is columns of Fig. 1f). g, Entropy of the posterior distribution as a function of (rare morph-maroon, frequent morph-blue).

