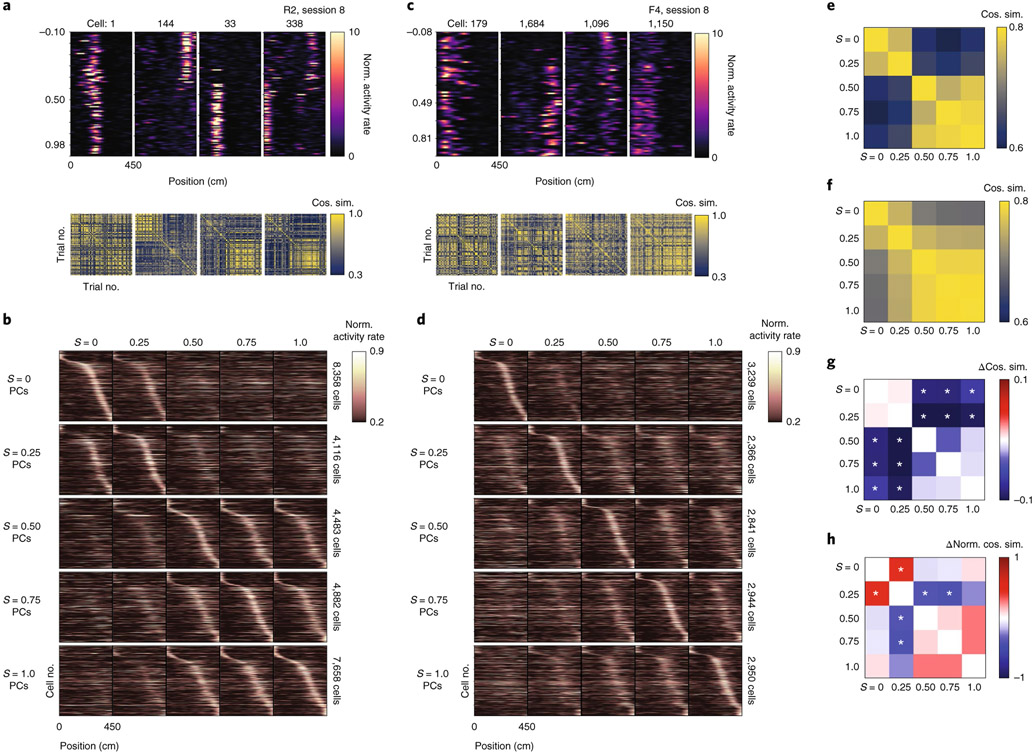
Fig. 2 ∣. Prior experience of stimulus frequency determines CA1 place cell remapping.
a, Top row: co-recorded place cells from an example rare morph session (mouse R2, session 8). Columns show heatmaps from different cells, with each row indicating the activity of that cell on a single trial as a function of the position of the mouse on the VR track (n = 120 trials). Rows are sorted by increasing morph value. The color indicates the deconvolved activity rate normalized by the overall mean activity rate for the cell (Norm. activity rate). Bottom row: trial-by-trial cosine similarity (Cos. sim.) matrices for the corresponding cell above, color coded for maximum (yellow) and minimum (blue) values. b, First row: for all rare morph sessions 8–N, place cells (PCs) were identified in the morph trials and sorted by their location of peak activity on odd-numbered trials. The average activity on even-numbered trials is then plotted (left-most panel). Each row indicates the activity rate of a single cell as a function of position, averaged over even-numbered morph trials. The color indicates the activity rate normalized by the peak rate from the odd-numbered average activity rate map for that cell. The trial-averaged activity rate map for these cells is then plotted for the other binned morph values using the same sorting and normalization process (remaining panels to the right). Second to fifth rows: same as the top row for the same rare morph sessions, but for place cells identified in the (second row), (third row), (fourth row) and (fifth row) morph trials. For each row, cells are sorted and normalized across all panels according to the place cells identified in the respective morph trial, c, Same as in a, but for an example frequent morph session (mouse F4, session 8, n = 75 trials). d, Same as in b, but for all frequent morph sessions 8–N. e, Average cosine similarity matrix for the union of all rare morph place cells in b. f, Average cosine similarity matrix for the union of all frequent morph cells in d. g, Rare morph cosine similarity matrix, from e, minus the frequent morph cosine similarity matrix from f (asterisks indicate significance based on a permutation test of mice across conditions, P < 0.05, two-sided). h, Same as g, but the cosine similarity matrix for each cell is z-scored before group comparisons (asterisks indicate significance based on a permutation test of mice across conditions, P < 0.0011, two-sided).

