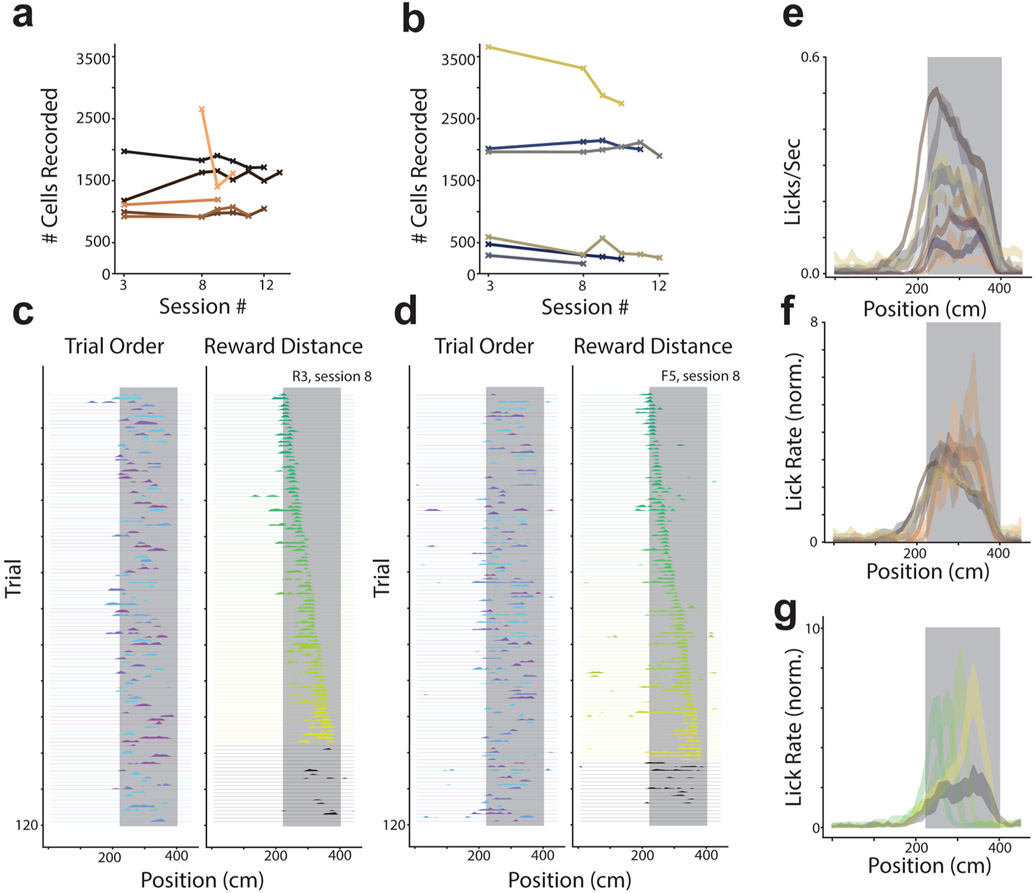
Extended Data Fig. 1 ∣. Licking behavior and number of cells recorded per session.
a, The number of cells identified per session is plotted for each rare morph animal individually. Each mouse shown as a different color. b, Same as (a) for all frequent morph animals. c, Single trial lick rate as a function of position is shown for an example rare morph session (R3, session 8; n = 120 trials). Left: Each row indicates the smoothed lick rate across positions for a single trial. The color of the row indicates the morph value (colormap in Fig. 1c). The grey shaded region indicates possible reward locations. Trials are shown in the order in which they occurred during the experiment. Right: Trials are sorted by the location of the reward cue. The color code also indicates increasing reward distance from the start of the track (green to yellow). Black trials are those in which the reward cue was omitted. d, Same as (c) for an example frequent morph session (F5, session 8; n = 120 trials). e, Across session mean lick rate (licks/sec) as a function of position (see [a-b] for number of sessions and color code) is plotted as a separated line for each mouse (R1-R6 & F1-F6; mean ± SEM). The color scheme for each mouse is the same as in the rest of the manuscript. Grey shaded region indicates possible reward location as in (c-d). f, The same data as (e) is normalized by the animal’s overall mean lick rate. g, Normalized mean lick rates were combined across rare and frequent morph animals. Trials were then binned by reward location (50 cm bins) and plotted as a function of position (across animal mean ± SEM). Color code is the same as (c-d).

