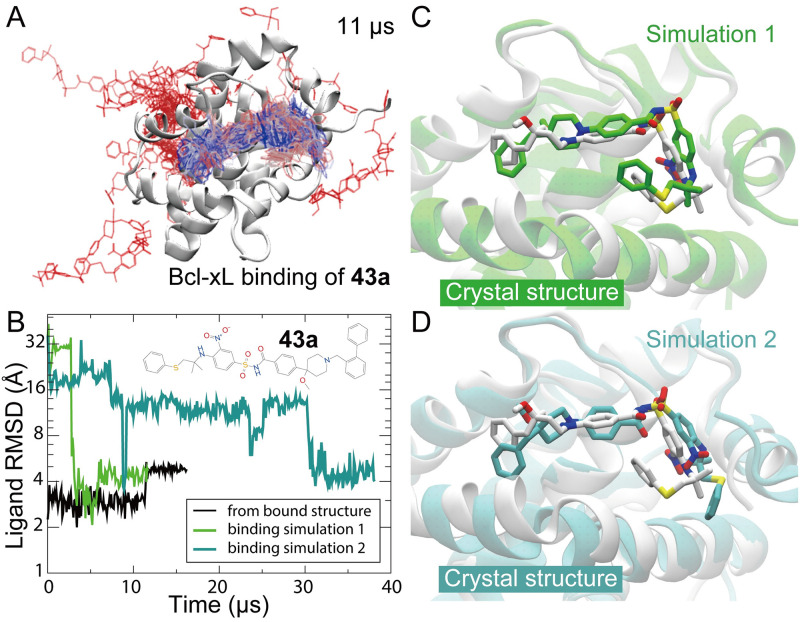
Fig 6. Compound 43a binding to Bcl-xL.
(A) Positions of the small molecule in an 11-μs simulation (Simulation 1) in which it reached the native binding pose. Simulation time is color-coded from red, to gray, to blue. (B) The RMSD of the small molecule with respect to the crystal structure (PDB 2O2M) in the binding processes of Simulations 1 (green) and 2 (cyan). Also shown is the RMSD of the small molecule in a simulation starting from the bound structure. All three simulations eventually settled at the same RMSD region. (C) and (D) The binding poses generated by Simulations 1 and 2, respectively, compared with the crystal structure. Note that simulation-generated binding poses are very similar but not identical to the crystal structure. The relatively minor discrepancies may be attributable to the force field for the small molecule.

