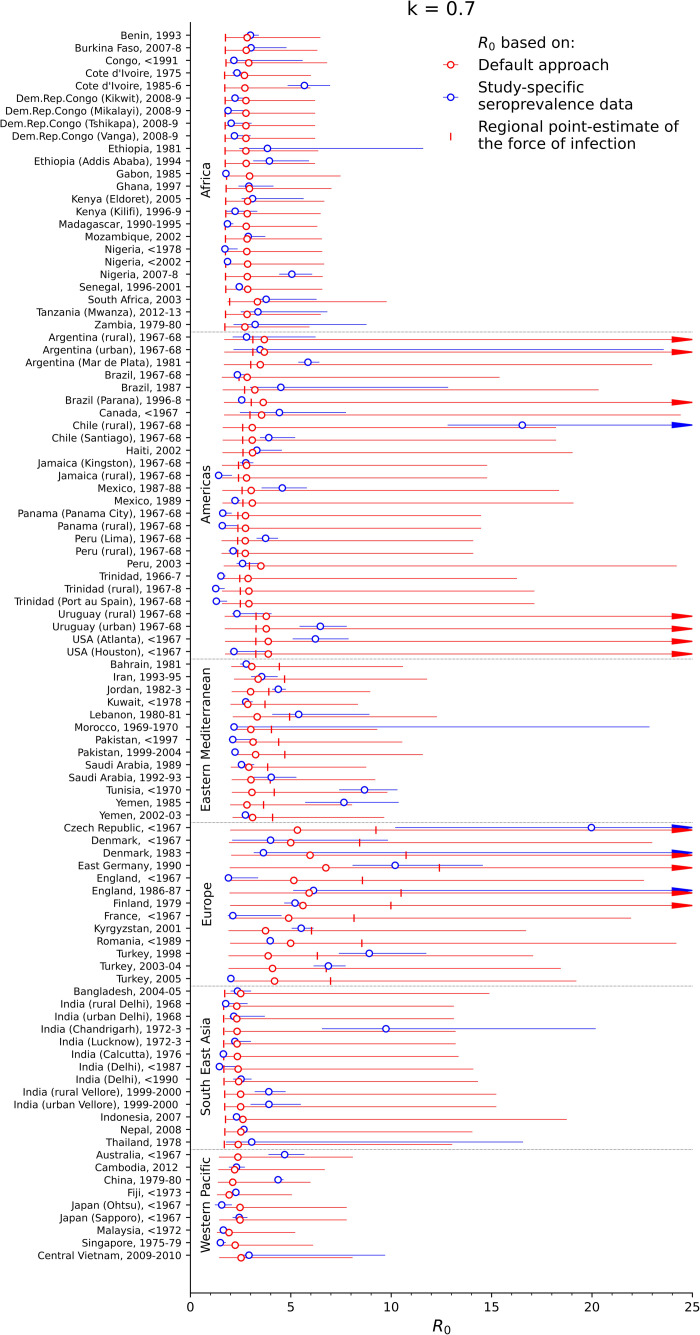
Fig 1. Estimates of the basic reproduction number for each of the studies.
The blue circles reflect the values calculated from study-specific seroprevalence data (study-specific point estimates), the red circles reflect the default R0 estimates and the vertical markers reflect R0 estimated from the regional point estimate of the force of infection. The red and blue bars reflect the 95% ranges of the study-specific and default estimates based on bootstrapping.

