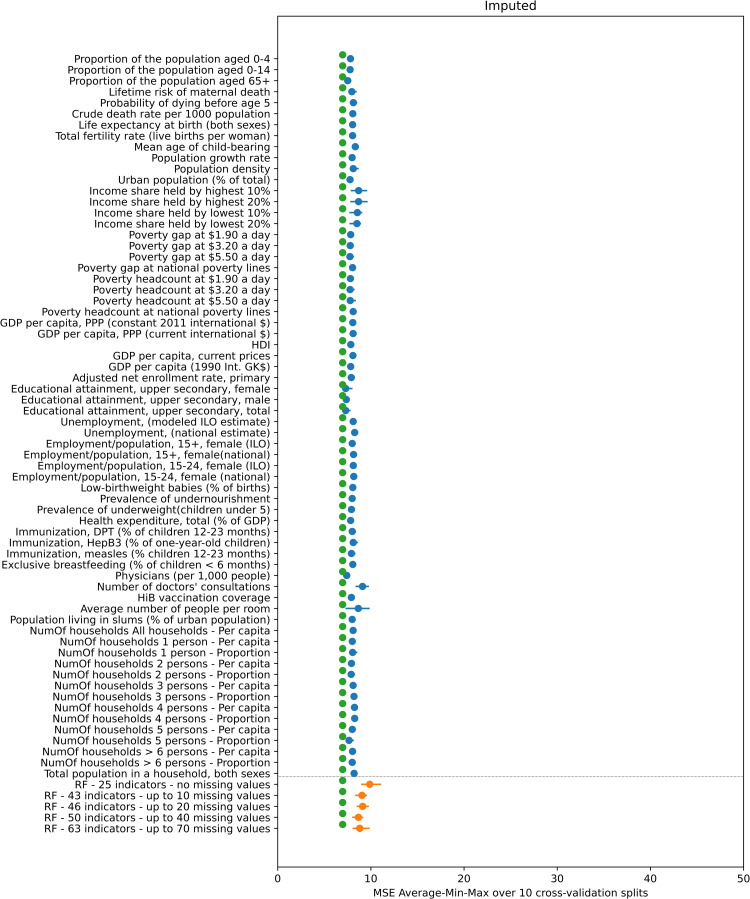
Fig 4. Mean value (blue and orange dots) and minimum-maximum value range (blue and orange line) of the MSE of the predicted R0 over the 10 repetitions of the 4-fold cross-validation experiment using the imputed dataset.
The blue color corresponds to the 66 linear regression results (one for each indicator) and the orange color to the 5 random forest results (one for each subset of indicators). The green dots indicate the average MSE for R0 as calculated using the default approach compared to that calculated using study-specific seroprevalence data.

