Figure 3.
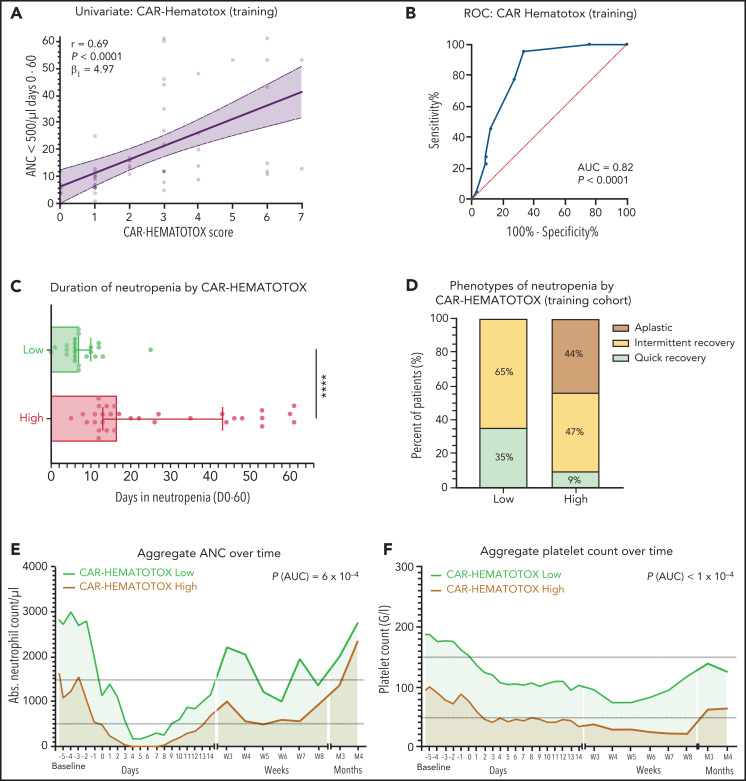
The CAR-HEMATOTOX score identifies patients with pronounced myelosuppression after CAR T-cell therapy. (A) Univariate analysis comparing the CAR-HEMATOTOX score to the duration of severe neutropenia in the training cohort (n = 55). The calculated slope (β1) of the simple linear regression is shown. (B) ROC curve of the influence of the CAR-HEMATOTOX score on the outcome of severe neutropenia at ≥14 days. The AUC and P value are shown. (C) Median duration of severe neutropenia (days 0-60) by CAR-HEMATOTOX score with whiskers indicating the 95% CIs. (D) Relative distribution of clinical phenotypes of neutrophil recovery by CAR-HEMATOTOX score. (E-F) Aggregated median ANC (E) and platelet count (F) over time for patients with either a low or high score. The P value is provided for the comparison of the calculated AUC for high-risk vs low-risk patients (supplemental Figure 6). Mann-Whitney U test ****P < .0001.

