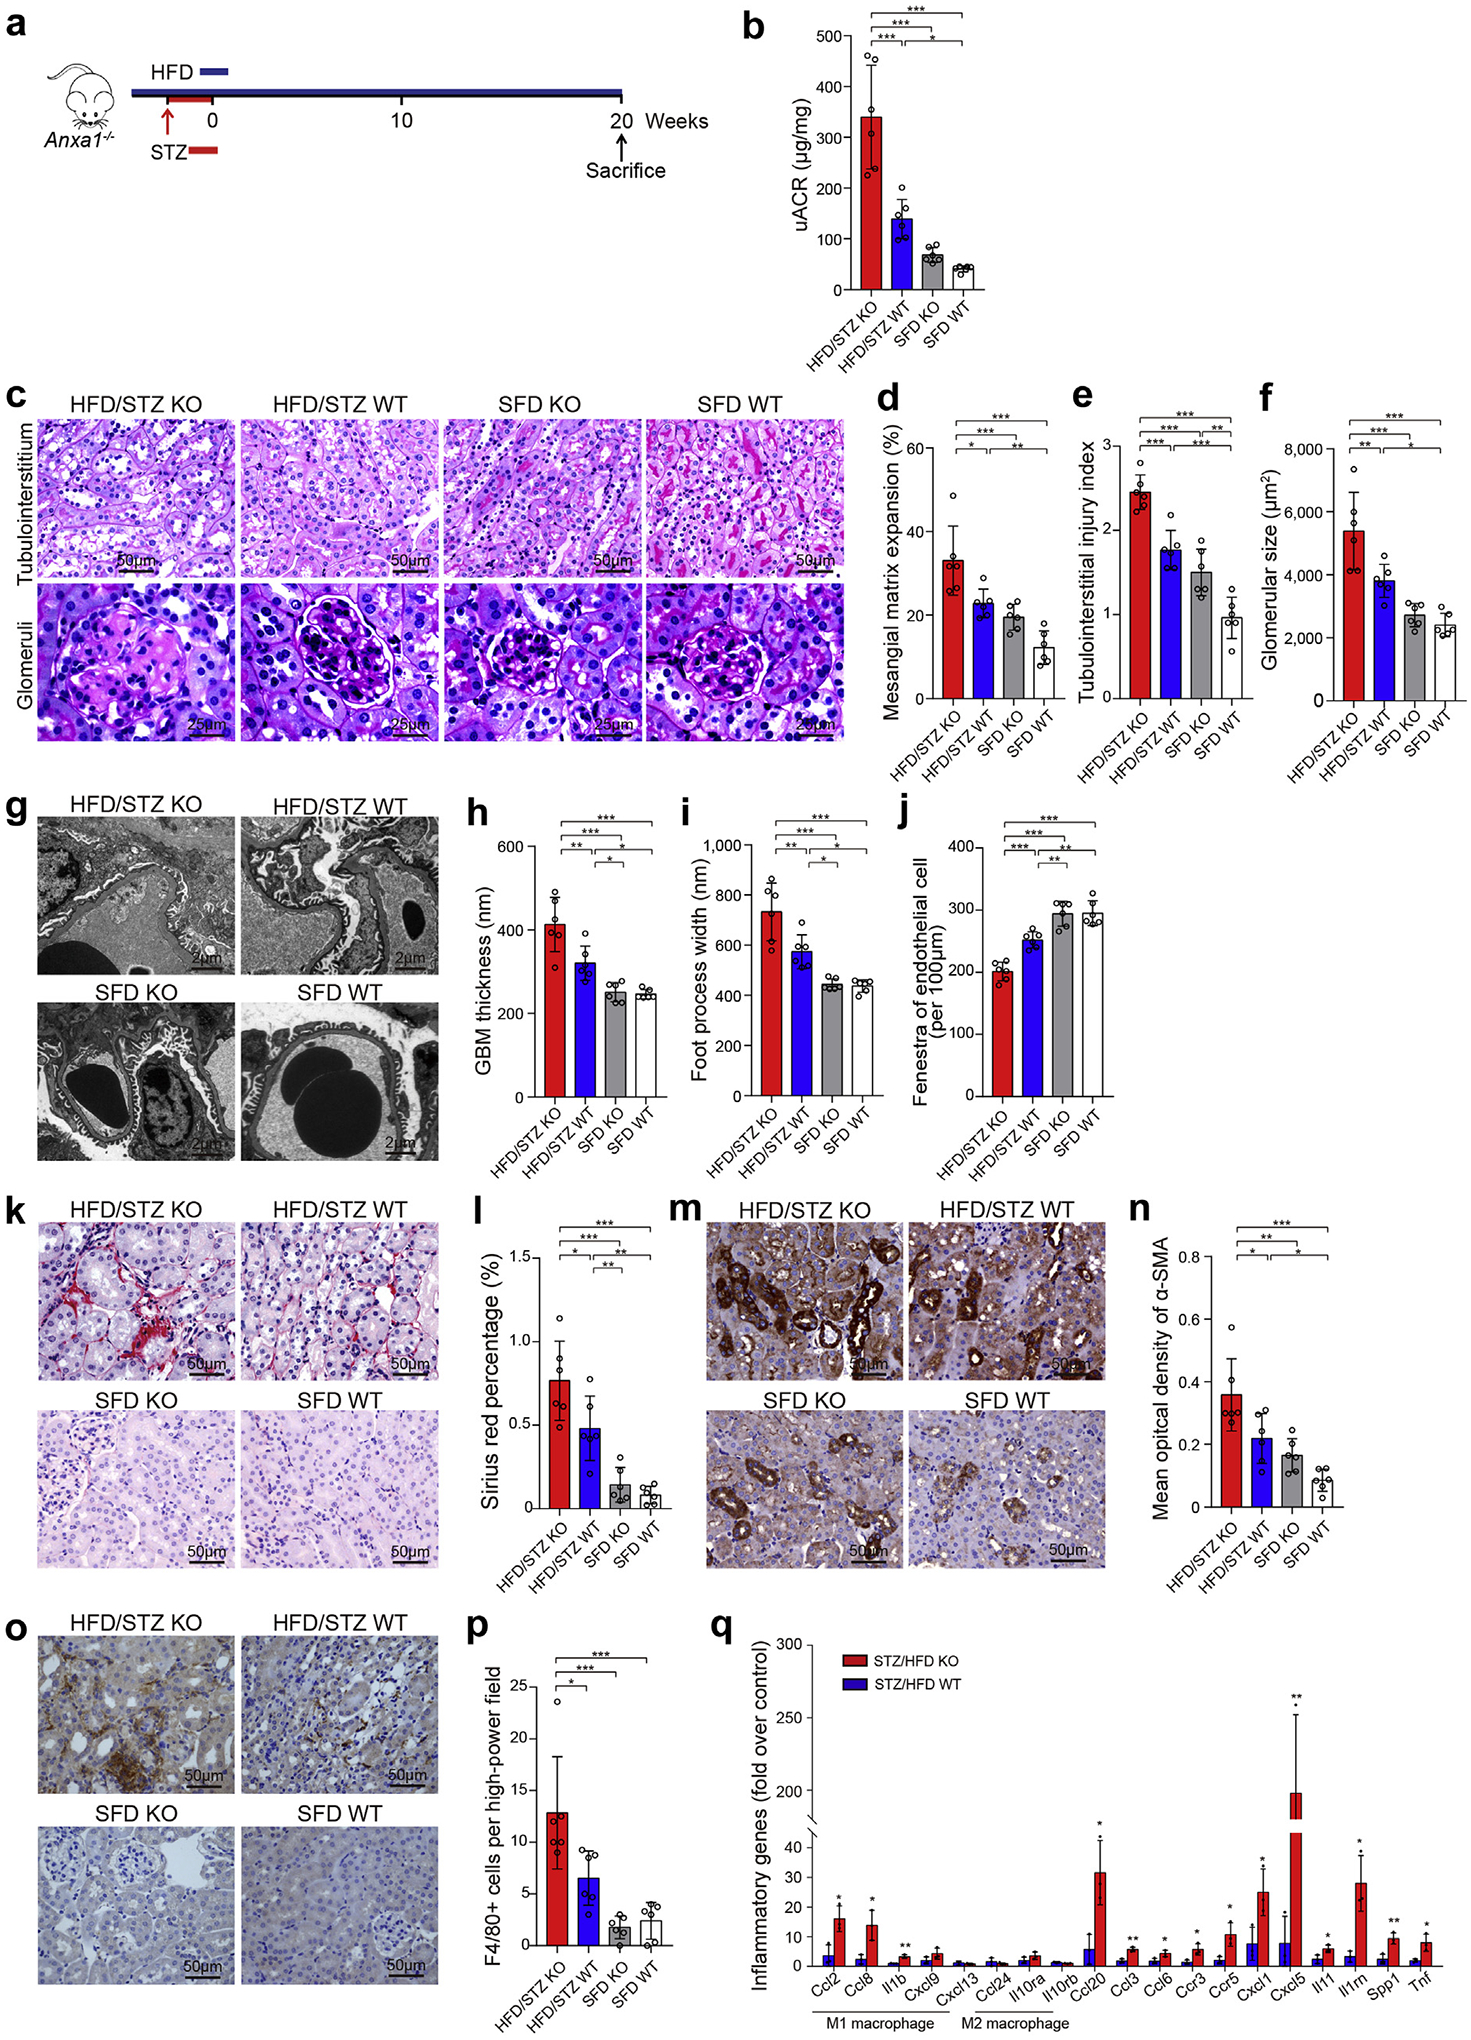
Figure 2 |. Annexin A1 (Anxa1) knockout (KO) aggravated nephropathy in high-fat diet (HFD) plus streptozotocin (STZ)-induced diabetic nephropathy mice.

(a) Study design overview. Eight-week-old Anxa1 KO mice were fed with an HFD for 1 month, followed by i.p. injection of 50 mg/kg STZ for 5 days. Mice were maintained for 20 weeks of HFD feeding before sacrifice. n = 6 per group. (b) Four groups were evaluated for urine albumin-to-creatinine ratio (uACR). (c) Representative photomicrographs of periodic acid–Schiff staining. Bar = 50 μm for tubulointerstitium and 25 μm for glomeruli. Quantification showing (d) mesangial matrix expansion, (e) tubulointerstitial injury index, and (f) glomerular size. (g) Representative photomicrographs of transmission electron microscopy. Bars = 2 μm. Quantification of (h) mean glomerular basement membrane (GBM) thickness, (i) mean foot process width, and (j) endothelial fenestrations in 4 groups. (k) Representative photomicrographs of Sirius red. Bars = 50 μm. (l) Quantitative analysis of Sirius red. (m) Representative photomicrographs of α-smooth muscle actin (α-SMA). Bars = 50 μm. (n) Quantitative analysis of α-SMA. (o) Representative photomicrographs of F4/80 staining. Bars = 50 μm. (p) Quantitative analysis of F4/80 staining. (q) Quantification of inflammatory gene expression by polymerase chain reaction array, HFD/STZ Anxa1 KO versus HFD/STZ wild-type (WT) mice (n = 3). Throughout, data analyses were performed by Student t test for 2 groups and 2-way analysis of variance, followed by a Tukey test, for 4 groups. Data are expressed as mean ± SD. *P < 0.05, **P < 0.01, and ***P < 0.001. SFD, standard fat diet. To optimize viewing of this image, please see the online version of this article at www.kidney-international.org.
